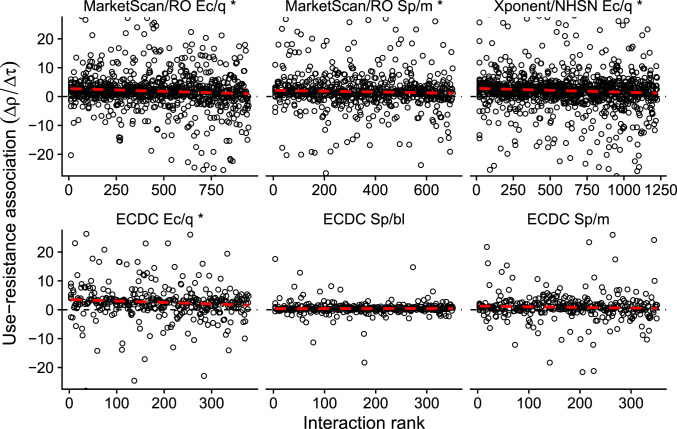
Fig. 4.
Use–resistance associations by ranked interaction. Each point represents the use–resistance association in a pair of US states (Top) or European countries (Bottom), the same pairs as shown in Fig. 3, rank ordered by increasing interpopulation interaction as inferred from transportation data. For visual clarity, the horizontal axes are truncated to exclude outliers. The dashed red line is a visual illustration of how increasing interaction is correlated with decreasing use–resistance associations (robust regression; compare SI Appendix, Tables S3 and S4). The asterisk (*) indicates a statistically significant association between increased interaction and decreased use–resistance relationship (SI Appendix, Table S3). Ec/q: E. coli and quinolones. Sp/m: S. pneumoniae and macrolides. Sp/bl: S. pneumoniae and β-lactams. RO: ResistanceOpen.

