Fig. 3.
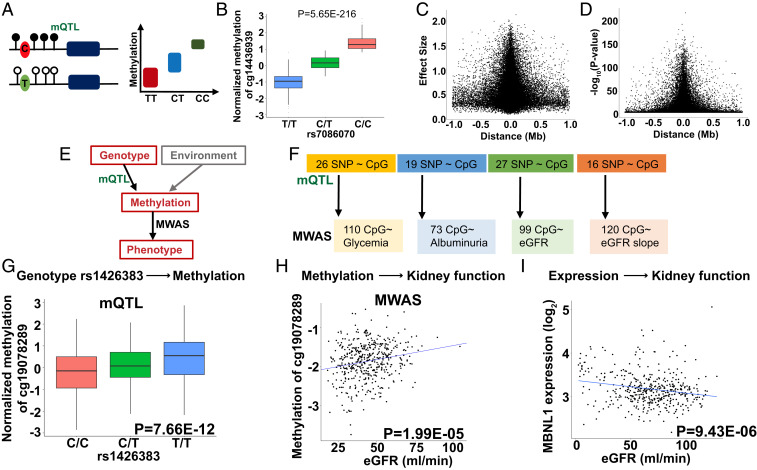
Genotype-driven methylation changes (mQTL) contribute to MWAS signals. (A) Schematic representation of mQTL; genotype-methylation association study. DNA methylation changes regulated by a nearby SNP. (B) An example of mQTL. Higher allele dosage C of the rs7086070 variant is associated with higher methylation levels of cg14436939 (P = 5.65E-216). The x axis shows the allelic dosage of rs7086070; y axis shows normalized methylation (INT-transformed M value). Center lines show the medians; box limits indicate the 25th and 75th percentiles; whiskers extend to the fifth and 95th percentiles; outliers are represented by dots. (C) The effect size (y axis) of the best mSNPs (the lead mQTL) decreases as the distance (x axis) from the transcription start site increases. n = 473 samples. (D) The strength of association (y axis) of the best mSNPs (the lead mQTL) decreases as the distance (x axis) from the transcription start site increases. n = 473 samples. (E) Both genetic variations and environmental changes contribute to methylation variation. Genotype-associated methylation changes can be uncovered by mQTL analysis, while MWAS analysis detects methylation and phenotype association. (F) Differentially methylated probes identified in DKD MWAS studies. The number of DMPs influenced by underlying genetic variants, identified by mQTL analysis. (G) Genotype and methylation association of rs1426383 variant and the methylation of cg19078289 identified by mQTL analysis of blood samples of CRIC participants. The x axis shows allele dosage of rs1426383; y axis shows normalized methylation (INT-transformed M value). Center lines show the medians; box limits indicate the 25th and 75th percentiles; whiskers extend to the 5th and 95th percentiles; outliers are represented by dots. n = 473 samples. (H) The methylation level of cg19078289 correlate with kidney function (eGFR) in CRIC study participants. The x axis: eGFR (mL/min); y axis: normalized methylation (INT-transformed M value), n = 473 samples. (I) Correlation of MBNL1 expression and kidney function in 433 microdissected human kidney samples (Dataset S16) (5). The x axis: eGFR (mL/min); y axis: expression (log2FPKM), n = 433 samples.

