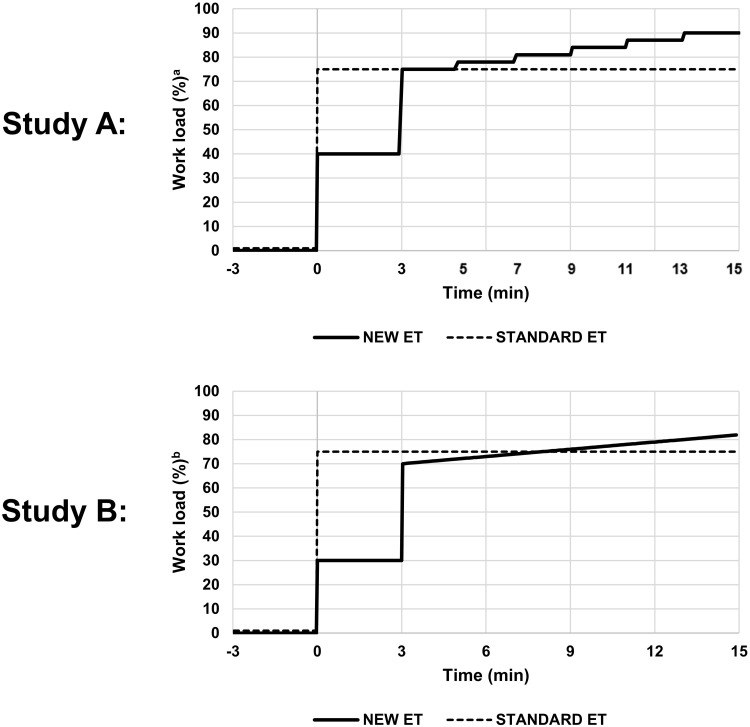
Figure 2.
Schematic design of the endurance tests in Study A and Study B.
Notes:aWorkload in % of maximum value obtained from the new maximum test (in the new endurance test) or from the standard maximum test (in the standard endurance test). bWorkload in % of maximum value obtained from the new maximum test. Baseline (−3 to 0 min) and recovery phase are similar in the new endurance test and the standard endurance test.
Abbreviations: ET, endurance test; min, minutes.

