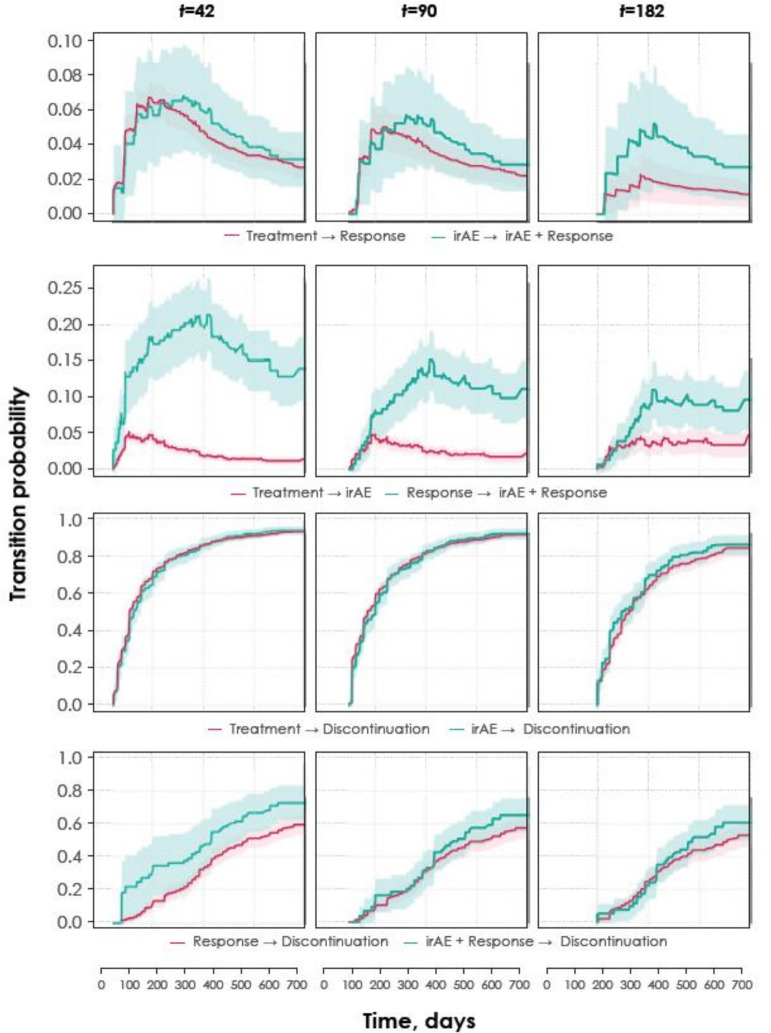
Figure 3.
Estimated probabilities that a patient transitions between given treatment events. Each row of panels depicts the probability beginning at three different time points (42, 90 and 182 days) after initiation of treatment that a patient transitions from a given model state to another. Shaded areas indicate 90% CIs. The first row compares the time varying transition probability for response given previous occurrence of irAE or not. The second row compares the time varying transition probability for irAE given previous occurrence of response or not. The third and fourth rows depict time varying transition probability for discontinuation with or without response comparing previous occurrence of irAE or not. irAE, immune-related adverse event.

