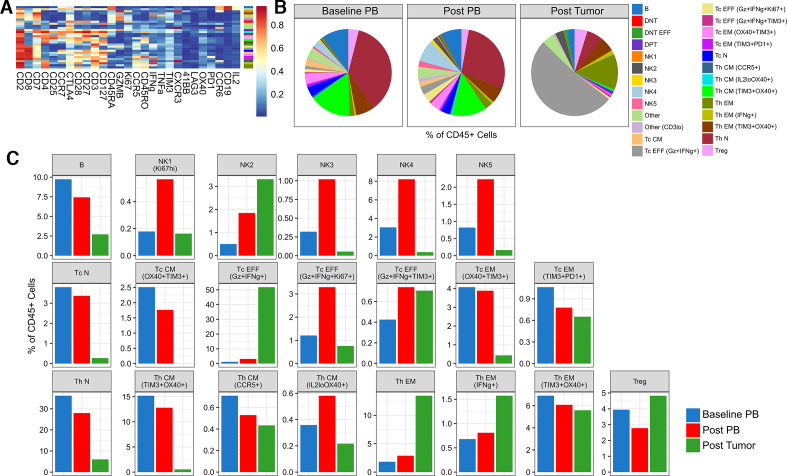
Figure 4.
Differences in the immune profiles of baseline and post-treatment specimens are revealed by CyTOF. (A) Heatmap of the normalized expression for all markers used during FlowSOM clustering for all CD45+ cells acquired from baseline and post-treatment samples using a T cell-oriented CyTOF panel. The color bar to the right of the expression heatmap describes how each cell type has been annotated. (B) Pie and (C) bar plots showing the differences in abundance of the resulting immune cell clusters as a percentage of total CD45+ cells, comparing baseline peripheral blood (PB), post-treatment PB, and post-treatment surgical tumor sample from the patient. CM, central memory; DNT, double negative T cells; DPT, double positive T cells; EFF, effector; EM, effector memory; N, naïve; NK, natural killer; Tc, cytotoxic T cells; Th, helper T cells; Treg, regulatory T cells.

