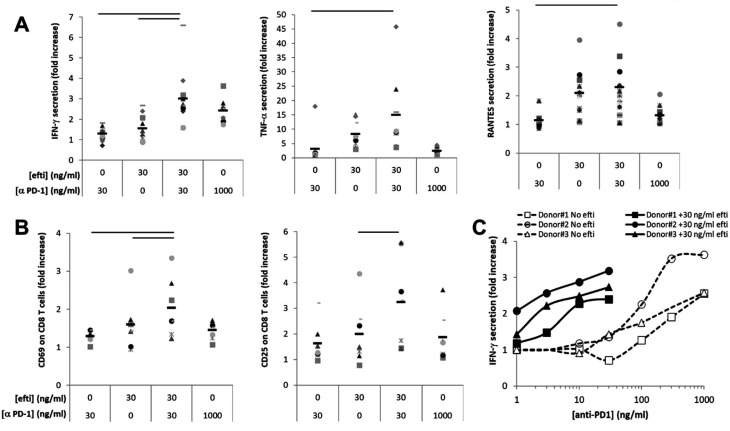
Figure 3.
Effect of efti plus anti-PD-1 combination on antigen-induced human T cell response. CMV-stimulated PBMCs from healthy donors were incubated in the presence of 0 or 30 ng/mL efti and in the presence of 0, 30 or 1000 ng/mL anti PD-1 antagonist antibody as indicated. Two days post-stimulation, supernatants were collected and concentration of IFN-γ, TNF-α and RANTES was measured (A). The expression of activation markers, CD69 and CD25 at the surface of CD8+ T cells was analyzed by flow cytometry (B). The results are shown in fold increase of levels of soluble biomarkers or the % of CD8 T cells expressing the indicated marker in the indicated condition to the value obtained in the absence of efti and anti-PD-1 antibody. Bars represent average of 10 donors for soluble analytes and seven donors for activation markers. Significant difference (p<0.05) between combined condition to either efti or anti-PD-1 Ab alone is displayed by a bar on the top of each graph. Panel (C) shows the IFN-γ concentration in cell supernatants of an anti-PD-1 dose–response experiment, either alone (opened markers, dashed lines) or combined with 30 ng/mL efti (close markers, plain lines), carried out with PBMC from three donors. The results are shown in fold increase of IFN-γ levels as a function of anti-PD-1 antibody concentration. CMV, cytomegalovirus; IFN, interferon; PBM, peripheralblood mononuclear; PD-1, programmed death-1.

