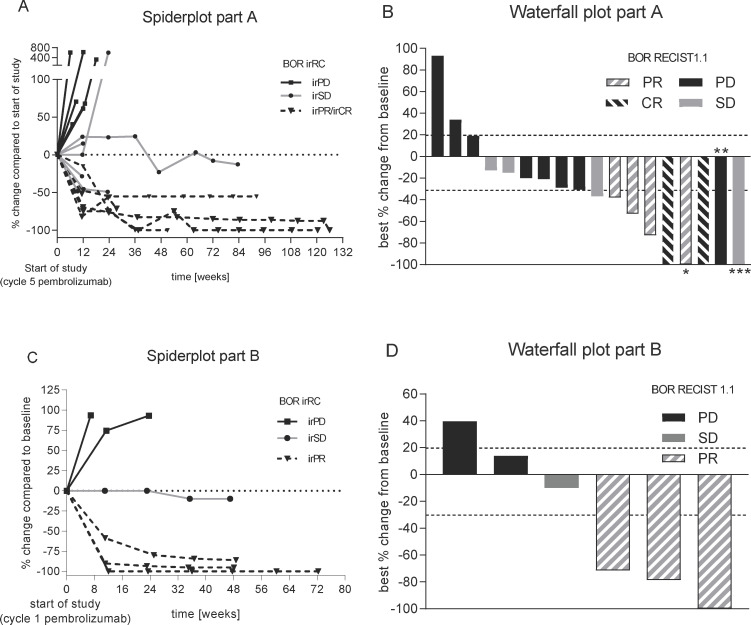
Figure 6.
Best overall response. Spider plot (left; A+C) as per irRC and waterfall plot (right, B+D) as per RECIST 1.1 for part A (top) and part B (bottom). Best overall response (BOR) as per RECIST1.1/irRC is displayed using the following code: black represents PD/irPD, gray SD/irSD, hashed gray Pr/irPR while hashed black CR/irCR, respectively. *Nontarget lesions (NTL) still present; **target lesions (TL) and NTLs disappeared, but new lesions (NL) were present at staging; ***time of CR of TLs; NLs appeared; staging before was SD (BOR is SD). irPD, immune-related progressive disease; irPR, immune-related partial response; irSD, immune-related stable disease.

