Figure S3.
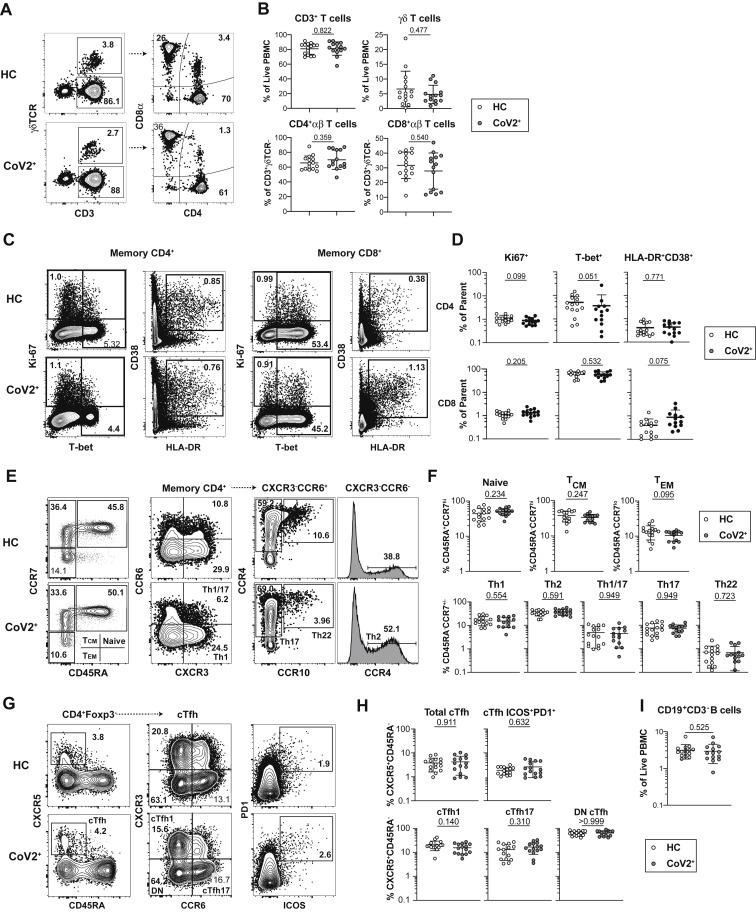
Bulk PBMCs Return to Immune Quiescence by Visit 1, Related to Figure 1
(A and B) Representative flow cytometry plots and frequencies of αβ and γδ T cell subsets at Visit 1 (V1) in PBMCs from healthy control (HC) and SARS-CoV-2-recovered (CoV2+) individuals.
(C and D) Representative flow cytometry plots and frequencies of CD4+ and CD8+ T cell effector/activation states (Ki67+, T-bet+, HLA-DR+CD38+) of total non-naive, memory CD45RA+CCR7+/− CD4+ or CD8+ T cells at V1 in HC and CoV2+ PBMCs.
(E and F) Representative flow cytometry plots and frequencies of CD4+ memory and T-helper subsets at V1 in HC and CoV2+ PBMCs.
(G and H) Representative flow cytometry plots and frequencies of cTfh (CXCR5+CD45RA-) and cTfh activation (ICOS+PD-1+) and helper (CXCR3+/−CCR6+/−) subsets at V1 in HC and CoV2+ PBMCs.
(I) Frequency of B cells (CD19+CD3-) at V1 in HC and CoV2+ PBMCs.
Statistics determined by two-tailed Mann-Whitney tests. Multiple testing correction significance cutoff at FDR = 0.05 is p value < 0.05. Error bars represent mean and SD. Data from two experiments.

