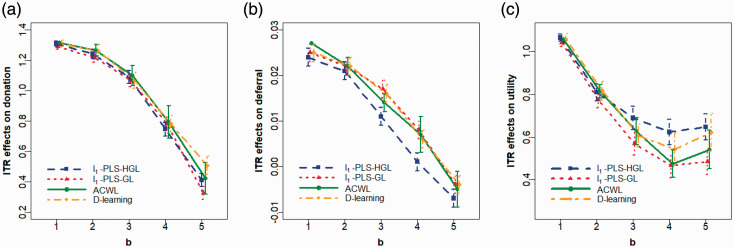
Figure 1.
Plots of the mean and 95% confidence intervals for ITR effects of the optimal ITR estimated using various methods as the trade-off parameter b in the utility function varies from 1 to 5 at an increment of 1. Optimal ITRs are estimated using data from male donors in the INTERVAL trial assuming the target is to maximize the utility. Methods to estimate the optimal ITR include l1-penalized least squares with hierarchical group LASSO variable selection (l1-PLS-HGL), l1-penalized least squares with group LASSO variable selection (l1-PLS-GL), adaptive contrast weighted learning (ACWL), and direct learning (D-learning). ITR effects on the (a) donation, (b) deferral, and (c) utility outcomes are presented. A larger ITR effect on donation/utility and a smaller ITR effect on deferral are more desirable.

