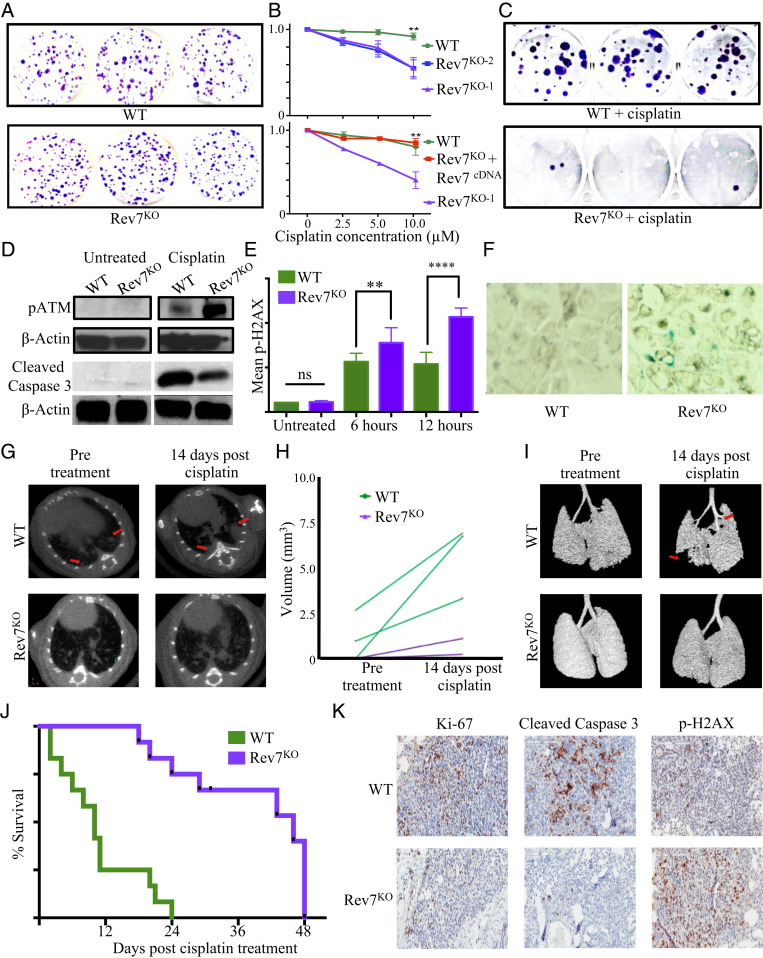
Fig. 1.
(A) Colony formation assay comparing untreated WT and Rev7KO cells. (B) Graph showing cell survival following cisplatin treatment was for WT versus Rev7KO cells. (C) Colony formation assay comparing WT and Rev7KO treated with 15 μM cisplatin. (D) Western blot loaded showing anti-pATMSER1981 (Above) or anti-cleaved caspase 3 (Below) staining in whole cell lysates from untreated or 10 µM cisplatin-treated WT and Rev7KO cells. (E) Quantification of anti-p-γ-H2AX antibody fluorescence intensity in WT and Rev7KO cells that were treated with 10 μM cisplatin for 12 h. (F) Representative pictures of SA (senescence associated) β-gal-stained WT and Rev7KO cisplatin-treated cells. (G) Representative axial images of mouse lungs harboring transplanted lung adenocarcinoma cells. Red arrowheads demarcate individual tumors in treated control mice that respond poorly to cisplatin treatment. (H) Graph showing individual tumor volume calculations for WT and Rev7KO transplants before and 2 wk after cisplatin treatment. (I) Three-dimensional isosurface projections of selected lung regions. Red arrows indicate lung adenocarcinoma mass. (J) Kaplan–Meier curve comparing survival of mice bearing WT and Rev7KO tumors following treatment with cisplatin (WT, n = 12, Rev7KO n = 12; median survival time = 10 and 46 d, respectively). P values were determined using a log-rank test. (K) Anti-Ki67, anti-cleaved caspase 3, and anti-p-γ-H2AX IHC of WT and Rev7KO tumor sections 48 h following treatment with 10 mg/kg cisplatin. **P ≤ 0.01; ****P ≤ 0.0001; ns, not significant.

