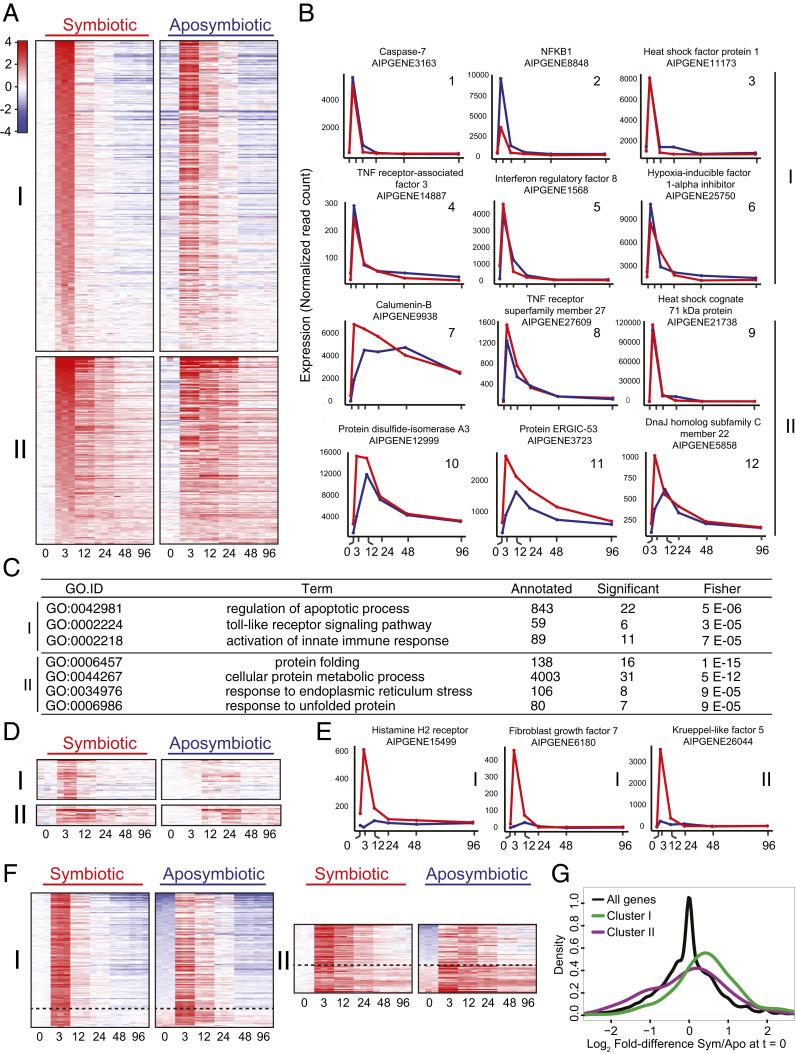
Fig. 2.
Rapid up-regulation of many genes in response to heat stress in both symbiotic and aposymbiotic anemones. (A) Heatmaps of genes significantly and highly up-regulated in symbiotic anemones in response to a shift from 27 °C to 34 °C (Left; see text for details) and of the same genes in aposymbiotic anemones (Right). Genes were grouped into two clusters by k-means clustering based on their expression patterns in the symbiotic animals and are sorted by their extents of up-regulation from 0 to 3 h in those animals. Expression values for each gene in the aposymbiotic animals (Right column) were also normalized to the value for that gene in the symbiotic animals at time = 0, and the genes are shown in the same order as in the Left column. Colors in the heatmap are based on a log2 scale (as shown). (B) Expression patterns for example genes in clusters I (plots 1 through 6) and II (plots 7 through 12). Data are shown as raw read counts normalized to library size (Materials and Methods). Red, data for symbiotic animals; blue, data for aposymbiotic animals. (C) Results from GO-term-enrichment analyses of each cluster. The terms shown are those significant in each cluster (Fisher’s P value <1e-4) and represented by ≥6 genes; the full outputs of these analyses are provided in Dataset S2. (D) Heatmaps (color scale as in A) showing genes from clusters I and II after normalizing each gene's expression level to its mean value in aposymbiotic animals at time = 0 and then sorting by the degree of up-regulation from 0 to 3 h in aposymbiotic animals. Shown here are only the genes in which up-regulation in the aposymbiotic animals was less than twofold at 3 h; the complete heatmaps are shown in SI Appendix, Fig. S1. (E) Examples of genes showing differential regulation between symbiotic and aposymbiotic anemones. The cluster number for each gene is indicated. Red, data for symbiotic animals; blue, data for aposymbiotic animals. (F) Heatmaps (color scale as in A) of genes as in A but after resorting based on the fold difference between symbiotic and aposymbiotic animals at time = 0. All genes are shown in which this difference was statistically significant (adjusted P value <0.05), independent of the magnitude of the expression difference or of whether expression was higher at 0 h in symbiotic or aposymbiotic animals. The dashed line separates the two groups, and the complete heatmaps are shown in SI Appendix, Fig. S2. (G) Smoothened-density histograms (Materials and Methods) of log2 fold differences between symbiotic and aposymbiotic animals at 0 h.

