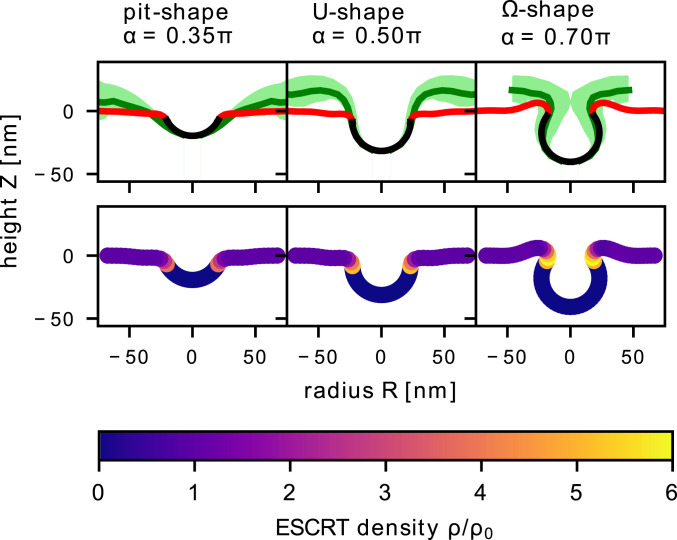
Fig. 3.
We compare the experimentally measured endosome shapes with the minimal energy shapes (Eq. 6) for different angles , when and . (Top row) The experimental membrane shapes (15) are grouped into three categories: pit shape (), U shape (), and shape (). For each subgroup the average shape is shown as a solid green line, while the SD is indicated by the shaded area. The ESCRT-free vesicle bud is shown by the solid black line, while the coated region is shown by the solid red line. (Bottom row) The ESCRT density is shown along the membrane for the three characteristic shapes, which exhibits an elevated ESCRT density in the neck region.

