Figure 1.
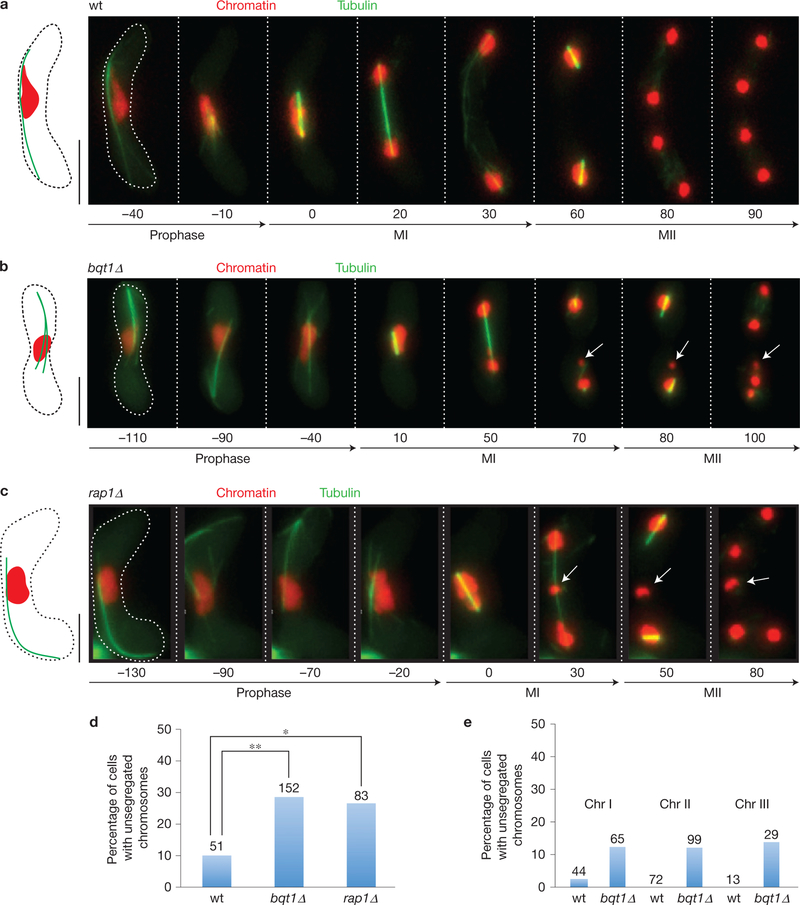
Bouquet-deficient meiocytes show failure of chromosome attachment to correctly formed spindles. (a–c) Series of frames from films of cells undergoing meiosis. Tubulin and histone H3 are observed via ectopically expressed GFP–Atb2 (green) and endogenous mRFP tagging of one of the two alleles encoding Hht1 (red), respectively. Numbers below frames represent minutes before or after MI. Scale bars represent 5 μm. (a) wt meiosis. All chromosomes attach properly to bipolar spindles at MI and MII. See also Supplementary Video 1. (b) bqt1Δ meiosis. The spindle forms correctly but some chromosomes (arrows) fail to attach to those spindles and remain unsegregated. See also Supplementary Video 2. (c) rap1Δ meiosis. Failed spindle attachment is seen for some chromosomes (arrows) as in bqt1Δ meiosis. (d) Quantification of the frequency of non-attachment events as observed via tagged histone H3 (expressed as percentage of cells with a chromosome remaining in the middle after metaphase). Number of cells filmed is indicated above each lane. Asterisk indicates significant differences from wt calculated using Fisher’s exact test (wt–bqt1Δ P =0.007, wt–rap1 P = 0.02, see Methods for details). (e) Frequency of non-attachment events of individual chromosomes expressed as the percentage of cells with a centromere or sub-telomeric region remaining unsegregated after anaphase. Chr I non-attachment was scored via the cenI–TetO/R system (see text). Chr II non-attachment was scored via the cenII–TetO/R system (see text). Chr. III non-attachment was scored via Reb1–GFP (see text). The sum of percentages for each individual chromosome matches the overall rate shown in d, indicating that whole chromosomes (rather than fragments) fail to segregate. Number of cells filmed is indicated above each bar.

