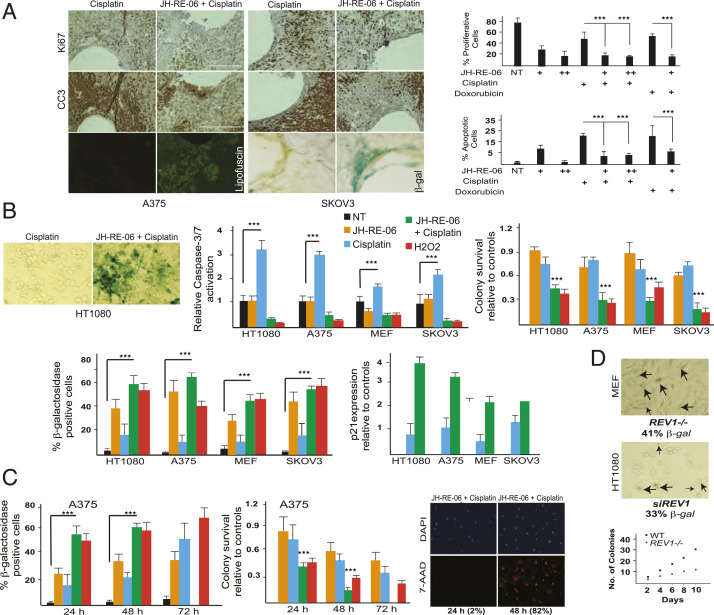
Fig. 1.
Cisplatin and JH-RE-06 induce senescence phenotypes. (A) Histology sections of the JH-RE-06 (1.5 μM as +; and 3 μM as ++) + cisplatin, and cisplatin (1 mg/kg) treated paraffin-fixed A375 (melanoma cells), or OCT-derived SKOV3 (ovarian cancer cells) tumors from xenograft mice showing differences in Ki67 and CC3 staining. Lipofuscin appears as green autofluorescence, and SA-β-Gal staining is a blue tissue stain. Representative graphs at Right show quantification of Ki67- and CC3-positive cells in the A375 xenograft mice model by ImageQuant software. n = 12 in both Xenograft models. P < 0.001 as determined by a Student t test is represented as ***. Cells that are not Ki67 or CC3 positive either represent stromal cells or nonproliferative, nonapoptotic tumor cells. B shows SA-β-Gal–positive HT1080 (fibrosarcoma) cells, which are quantified in the bar graph for HT1080, A375, MEFs (mouse embryonic fibroblasts), and SKOV3 following 24 h treatments: NT (no treatment with drugs), JH-RE-06 (1.5 μM), cisplatin (1 μM), JH-RE-06+cisplatin, and H2O2 (a positive control for senescence; 0.3 μM). Also seen in bar graphs are the relative levels of Caspase 3/7 activation, colony survivability, and p21 expression levels as quantified via qRT-PCR. (C) Bar graphs quantifying SA-β-Gal–positive cells over the course of 72-h treatment with different drug combinations (same concentrations as in B, except JH-RE-06 is at 0.5 μM) in A375 cells. The graph below shows relative colony survival in A375 cells exposed to same concentration of drugs for 48 and 72 h. Immunofluorescence (IF) panels show DAPI-stained nuclei and 7-AAD–stained necrotic A375 cells over 24- and 48-h incubation time frame within the same experiment. D shows SA-β-Gal–positive REV1−/− MEF and siRNA REV1 knockdown HT1080 cells. Graph shows impaired colony formation in the REV1−/− MEF compared to the WT MEF counterparts.

