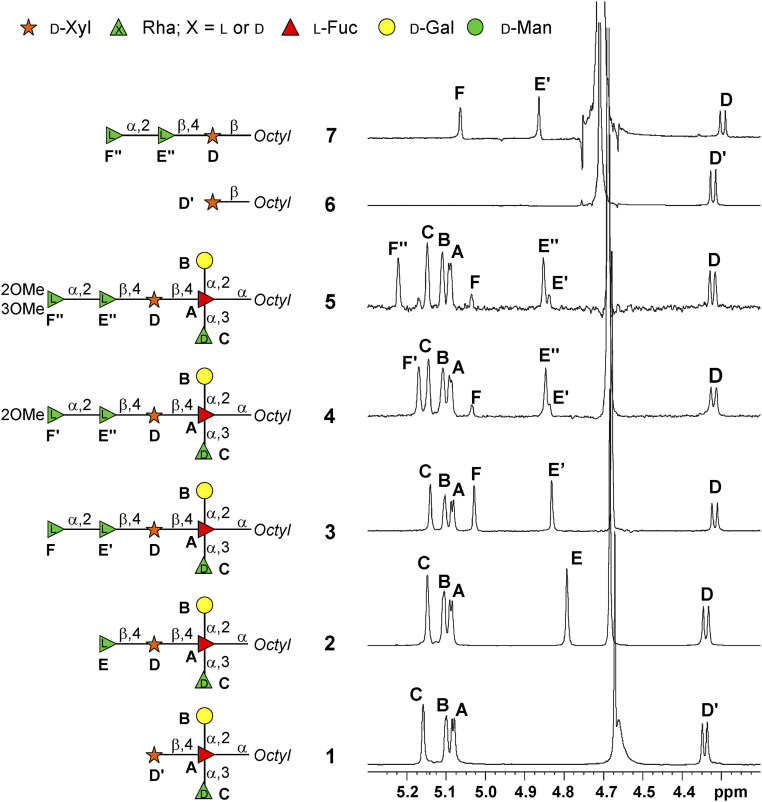
Fig. 2.
(600 MHz and 310 K, D2O) 1H NMR spectra detailing the anomeric region of the oligosaccharides 1–7, drawn as a cartoon next to each spectrum. Each monosaccharide unit is labeled with a capital letter, and the full NMR attribution of each compound is reported in the SI Appendix. The peak at ca. 4.7 ppm is the residual solvent signal.

