Fig. 2.
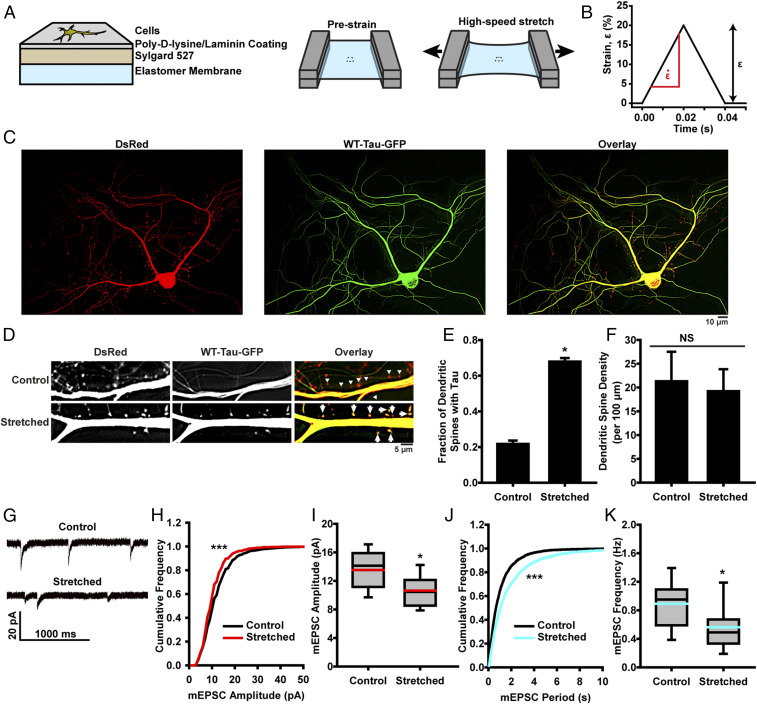
Neurons exposed to high-strain rate deformation exhibit tau abnormalities and synaptic functional deficits. (A) Schematic representation of in vitro TBI system construct fabrication and stretching. (B) Prescribed temporal wave form for a stretch of 20% strain (ε) and 1,000%/s strain rate . (C) Representative images of cultured rat hippocampal neurons transfected with DsRed (Left) and WT-Tau-GFP (Center). Images overlaid to assess tau mislocalization (Right). (D) Representative images of tau mislocalization in to dendritic spines in control and stretched neurons. Arrows denote spines with tau, and triangles indicate spines without tau. (E) Quantification of tau mislocalization, measured as fraction of spines with tau present, in unstretched control and stretched neurons (mean ± SD). Spines/images: control, 669/23; stretched, 524/7. (F) Spine density in unstretched control and stretched neurons (mean ± SD). (G) Representative mEPSCs recorded from unstretched control and stretched neurons. (H) Cumulative frequency of mEPSC amplitude (black, control; red, stretched). K-S test: D/Dcrit = 4.31, α = 0.05, bins = 1 pA. (I) Quantification of mEPSC amplitudes (black line, median; red line, mean; box, 25 to 75%; whisker, 10 to 90%). (J) Cumulative frequency of mEPSC peak-to-peak period (black, control; teal, stretched). K-S test: D/Dcrit = 5.48, α = 0.05, bins = 50 ms. (K) Quantification of mEPSC frequency (black line, median; teal line, mean; box, 25 to 75%; whisker, 10 to 90%). Cells/mEPSCs: control, 18/4,360; stretched, 23/3,139. In all plots, *P < 0.05, ***P < 0.001 compared to control, and NS is not significant.

