Fig. 4.
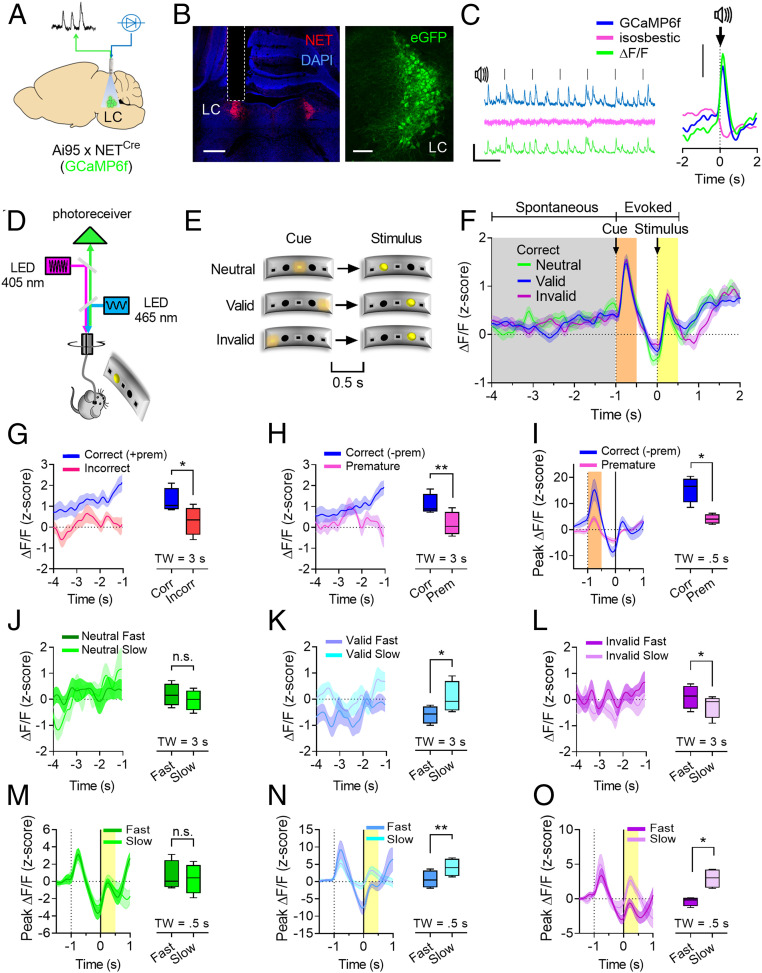
LC calcium activity reflects a trade-off between top-down and bottom-up attention. (A) Approach used for FP recordings of LC calcium activity. (B) Confocal tile scan showing optic fiber placement (Left; scale bar, 500 µm) and GCaMP6f expression in LC neurons (Right; Scale bar, 100 µm). (C) Representative FP traces of LC recordings during white-noise stimulation (Left; scale bar, 10 s × 5% ΔF/F) and FP traces aligned to 1 s white noise stimuli (Right; 144 trial, four mice; scale bar, 1% ΔF/F). (D) Strategy for the recording of calcium transients in Ai95 x NETCre mice during the cued version of the two-choice task. (E) Trial types used in the cued version of the two-choice task during FP recordings. (F) Peri-event histogram showing LC calcium activity during correct trials segregated by trial type and aligned to target stimuli for the analysis of spontaneous (gray, 4 s) or evoked (orange and yellow, 0.5 s) LC activity. (G) Comparison of LC spontaneous activity between correct and incorrect trials. (H) Comparison of LC spontaneous activity between correct and premature trials. (I) Comparison of LC activity evoked by cues during correct and premature trials. LC spontaneous activity divided by Fast and Slow trials during Neutral (J), Valid (K), or Invalid (L) trial types. LC activity evoked by target stimuli divided by Fast and Slow trials during Neutral (M), Valid (N), or Invalid (O) trial types. (n = 4 mice; 150 trials/subject). Correct trials do not include premature trials (– prem) except in G. Data are expressed as mean ± SEM of n = 4 mice. Box and whiskers plots represent the five-number summary. TW: time window analyzed (in seconds). Paired t tests are two-tailed. n.s., not significant; *P < 0.05; **P < 0.005.

