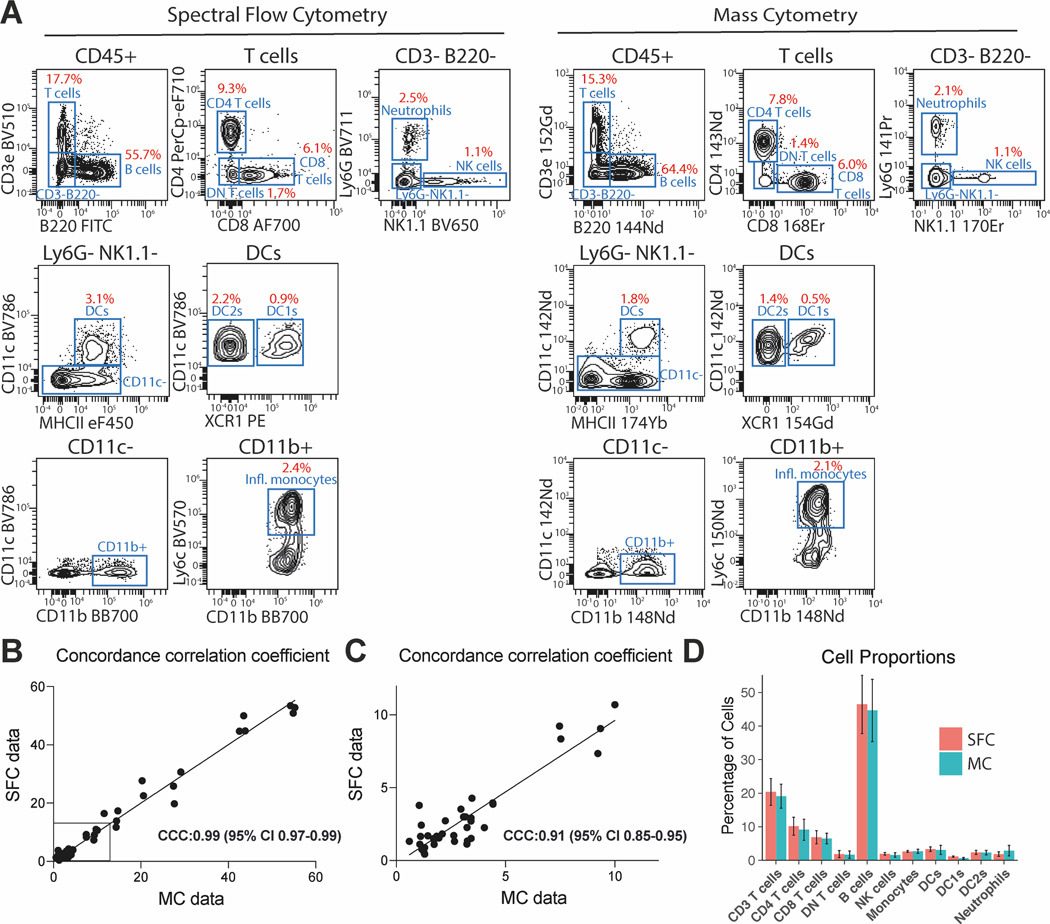
Figure 1. Expert gating strategy for SFC and MC data and their correlation.
(A) Representative biaxial plots showing the gating strategy for SFC and MC data sets and population frequencies. Intact single cells were pre-gated on Forward and Side Scatter Area and Height properties for SFC, Event Length and Intercalator Uptake for MC. Single cells were then assessed for viability and expression of CD45. (B) Gated cell populations for all samples (n=3+2 from two independent experiments) were compared between both data sets and the concordance correlation coefficient was calculated to measure the similarity between both data sets. (C) Values plotted for cell populations with a frequency below 10% were plotted separately, to allow for better visualization. (D) Mean observed cell proportions for SFC and MC samples (n=3+2 from two independent experiments) were plotted and the 95% confidence intervals are shown. A calculation of the two-tail difference between means t-test showed no significant difference between any of the cell populations from the SFC and MS data sets (smallest p-value was 0.223 for DC1s).

