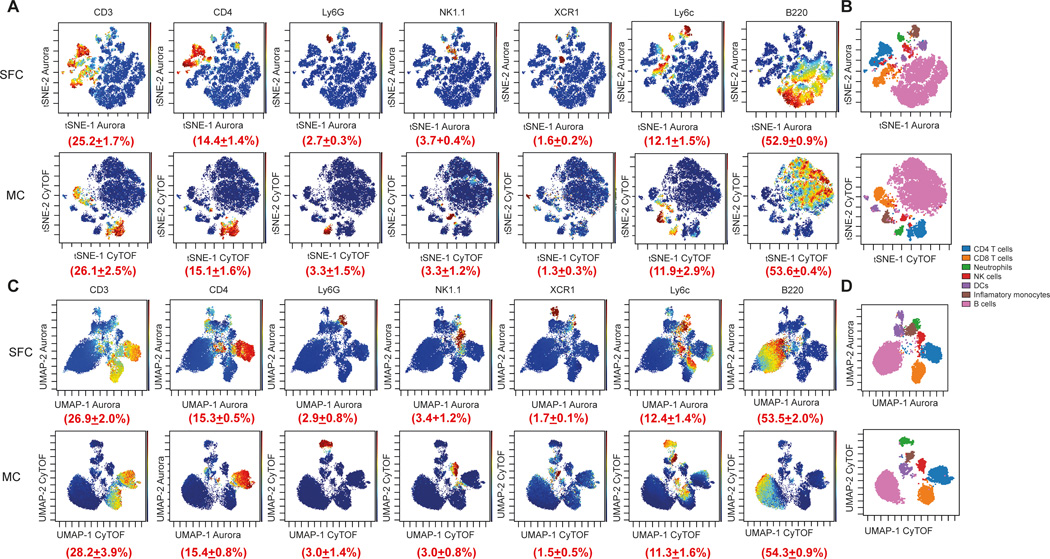
Figure 2. Comparison of marker expression by t-SNE and UMAP from two comparable MC and SFC data sets.
For both data sets, CD45+/Single/Live cells were used for analysis, downsampled to equal cell numbers and the individual samples concatenated. (A) t-SNE analysis was performed with 7,500 iterations with perplexity of 50 and displayed in 2D plots using the resultant t-SNE 1 and t-SNE 2 dimensions according to the per cell expression of 16 proteins. Expression levels of CD3, CD4, Ly6G, NK1.1, CD11c, Ly6c and B220 and the population frequency (±SD) of positively stained populations are shown. t-SNE scales were normalized to −800 to 800 for each marker and visualized using a rainbow heat scale (arcsinh). (B) Expert gating overlay of CD4 T cells, CD8 T cells, neutrophils, natural killer (NK) cells, dendritic cells (DCs), inflammatory monocytes and B cells on t-SNE dimensions 1 and 2. (C) UMAP analysis was performed with default FlowJO settings of nearest neighbours of 15 and minimum distance of 0.5 using the Euclidean distance function and displayed in 2D plots using the resultant UMAP 1 and UMAP 2 dimensions according to the per cell expression of 16 proteins. Expression levels of CD3, CD4, Ly6G, NK1.1, CD11c, Ly6c and B220 and the population frequency (±SD) of positively stained populations are shown. UMAP scales were manually normalized for each marker (see Materials and methods for details) and visualized using a rainbow heat scale (arcsinh). (D) Expert gating overlay of CD4 T cells, CD8 T cells, neutrophils, natural killer (NK) cells, dendritic cells (DCs), inflammatory monocytes and B cells on UMAP dimensions 1 and 2.

