
Figure 2. Broad-Spectrum Antibiotic Treatment Improves Colitis in Il10−/− Tnfr1−/− Mice.
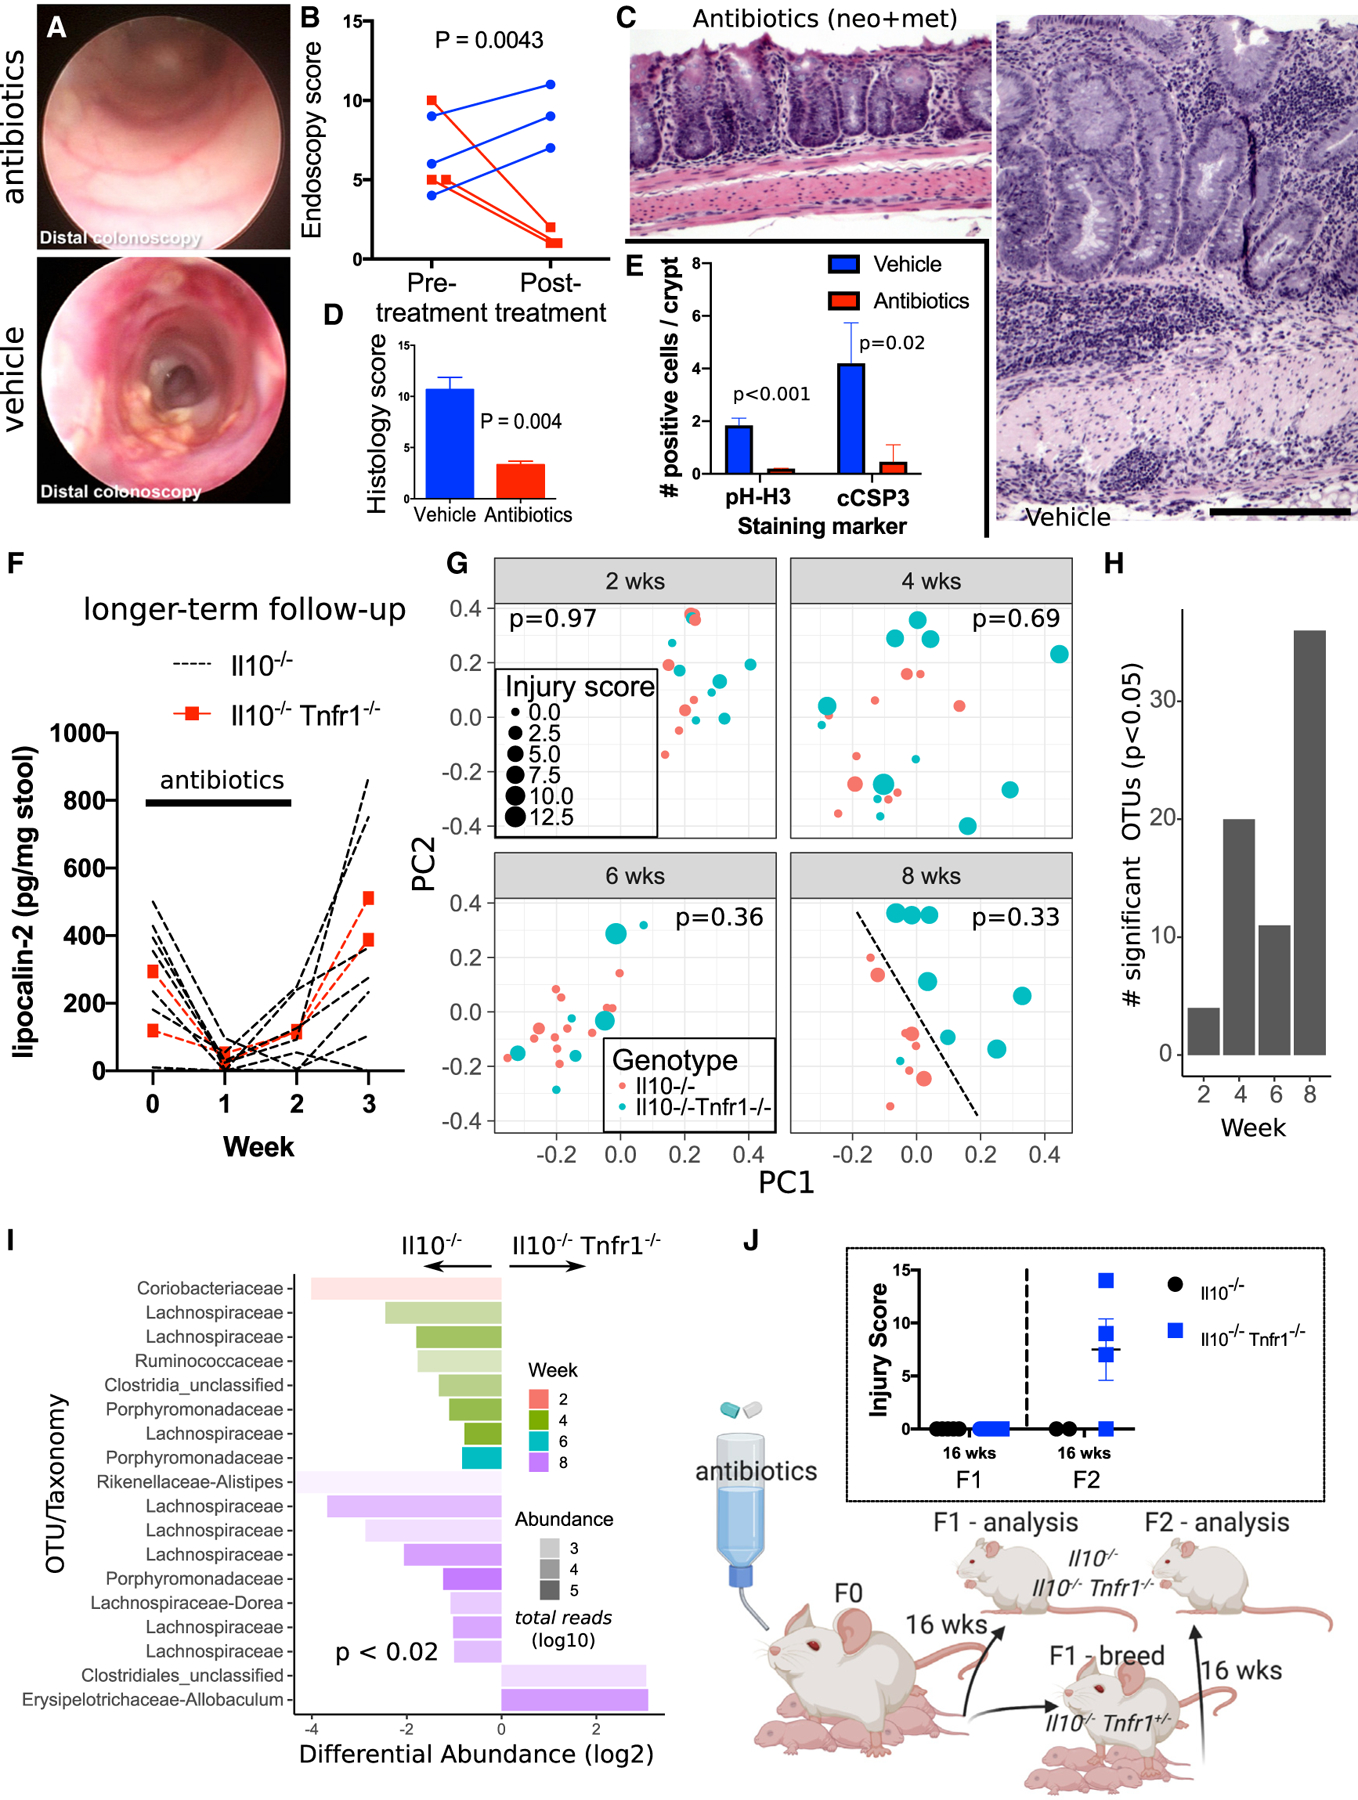
(A–E) Improved endoscopic appearance (A), endoscopic score (B), histology (C and D), and crypt cell dynamics (E) were observed in 8-week-old antibiotic-treated Il10−/− Tnfr1−/− mice (n = 3) compared with controls (n = 3).
(F) Fecal lipocalin levels diminished to nearly undetectable levels during antibiotic treatment of Il10−/− (n = 7) and Il10−/− Tnfr1−/− (n = 2) mice but quickly rebounded.
(G) 16S analysis of Il10−/− Tnfr1−/− and Il10−/− cecal microbiomes collected from 2-, 4-, 6-, and 8-week-old Il10−/− Tnfr1−/− and Il10−/− mice. Shown are weighted UniFrac distances plotted using multidimensional scaling. Each sample is coded by age (gray facets), genotype (color), and colitis score (size). At 8 weeks old, the genotypes could be qualitatively discriminated (dotted black line). The displayed p value for each age is computed by permuted analysis of variance using littermates, colitis severity, sex, and genotype conditioned on dam identity as model factors.
(H) Bar graph displays the total number of significant operational taxonomic units (OTUs) that are differentially abundant in Il10−/− versus Il10−/− Tnfr1−/− animals by age.
(I) OTUs with taxonomic classifications plotted to indicate their relative abundance in Il10−/− Tnfr1−/− versus Il10−/− samples. The transparency of the bars denotes the total abundance of the OTUs on a log scale (more transparent is less abundant).
(J) Depiction of the multigenerational experiment analyzing the effects of maternal antibiotic treatment on colitis development, with associated colitis scoring shown in the inset.
Scale bars: 200 μm. Error bars: standard error.