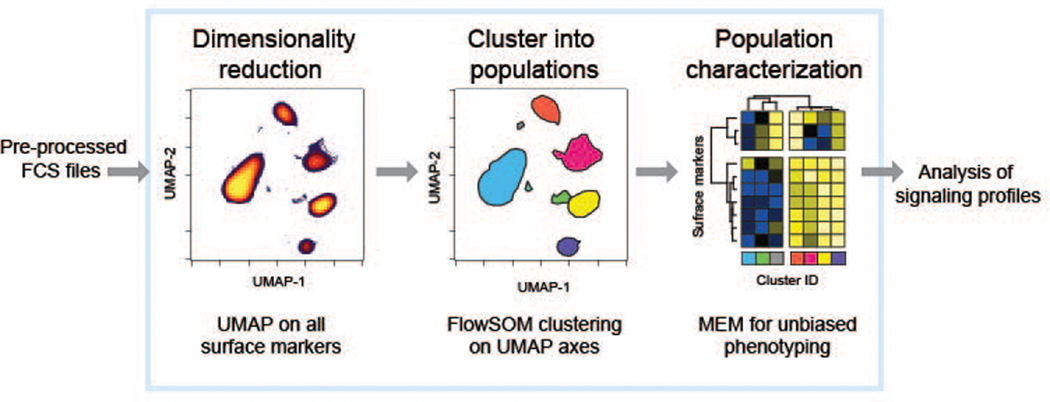
Figure 2.
A semi-automated analysis workflow introduces trainees to multidimensional analysis and computational tools. Manually pre-processed FCS files are read into the R pipeline, symbolized here by a large light box, where multidimensional data is reduced to two dimensions using UMAP for ease of visualization and simplification of subsequent clustering using FlowSOM. The population clusters identified by FlowSOM are then phenotypically characterized by MEM, and these cluster IDs along with the UMAP coordinates are encoded into a new FCS file, which can be exported and analyzed by any means desired.

