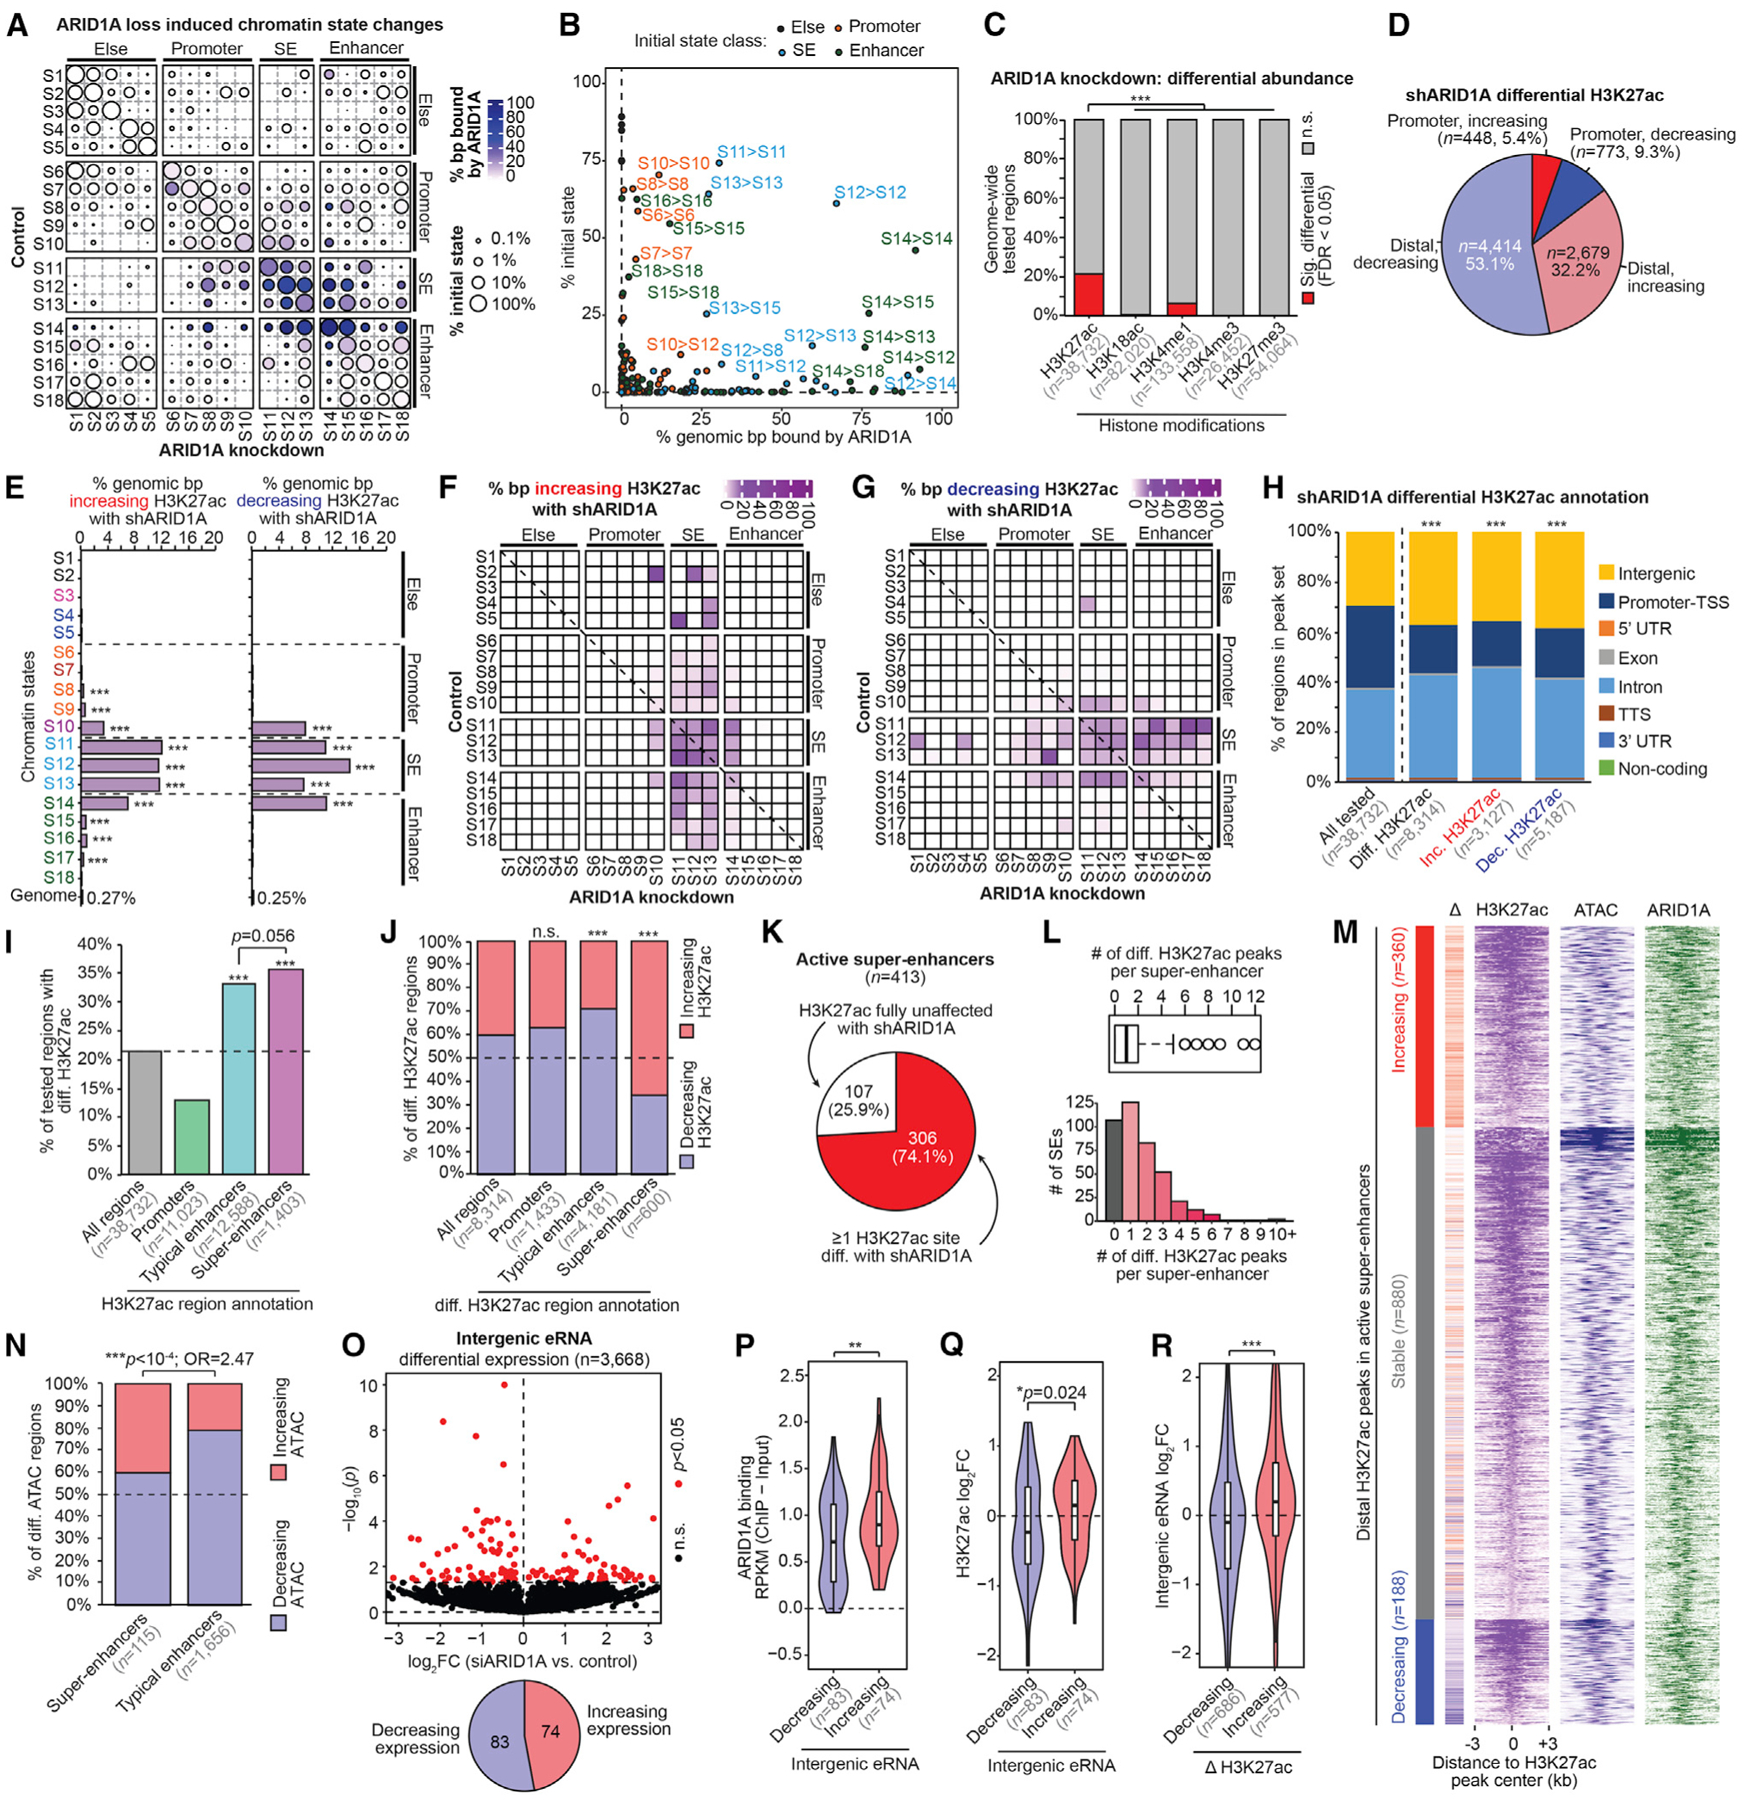
Figure 2. ARID1A Prevents H3K27 Hyperacetylation at SEs.

(A) Map of chromatin state changes following ARID1A loss. For each state-state change, circle size depicts the relative amount of that state change compared to the initial genome-wide state representation ([genomic bp initial → final]/[genomic bp initial]), and color indicates the proportion bound by ARID1A.
(B) Scatterplot of the 2 features quantified in (A) for each state-state change. Each dot representing a state-state change is further colored by its initial state class: S1–S5, “else”; S6–S10, “promoter”; S11–S13, “SE”; S14–S18, “enhancer.” The most prominent state-state changes are labeled as [initial] > [final].
(C) Proportion of genome-wide regions displaying significant (FDR < 0.05) differential abundance following ARID1A loss for each histone modification. Tested regions are the union of replicate-overlapping peak sets per assay. The pairwise statistic is the 2-tailed Fisher’s exact test.
(D) Gene proximity and directionality of significant differential H3K27ac sites (FDR < 0.05, n = 8,314).
(E) Genomic enrichment for (left) increasing H3K27ac or (right) decreasing H3K27ac following ARID1A loss at each chromatin state compared to the whole genome. The statistic is hypergeometric enrichment.
(F) Map of chromatin state changes as in (A), but overlaid color feature is the proportion of state-state base pairs displaying increasing H3K27ac.
(G) Map of chromatin state changes as in (F), but for decreasing H3K27ac.
(H) Distribution of genomic features of all tested H3K27ac regions compared to differential (total, increasing, or decreasing). The statistic is the chi-square test.
(I) Enrichment of differential H3K27ac among promoters, TE or SE, compared to all tested H3K27ac regions. The statistic is hypergeometric enrichment and pairwise 2-tailed Fisher’s exact test.
(J) Proportion of increasing versus decreasing H3K27ac at significant differential regions binned by promoter, SE, and TE, compared to all differential regions. The statistic is hypergeometric enrichment.
(K) Percentage of active SE (n = 413) with at least 1 H3K27ac peak displaying differential H3K27ac upon ARID1A loss.
(L) Number of differential H3K27ac regions per SE depicted as a boxplot in the style of Tukey (top) or a histogram (bottom). The median number of differentially acetylated regions per SE is 1.
(M) Signal heatmap at distal H3K27ac peaks located within SEs, segregated by differential H3K27ac status: increasing (n = 360), decreasing (n = 188), or stable (n = 880). Each peak subset is ranked by H3K27ac signal in the control cells. Delta corresponds to H3K27ac log2 fold change (log2FC) from small hairpin ARID1A (shARID1A) versus control: red values, increased H3K27ac; blue, decreased H3K27ac.
(N) Proportion of increasing versus decreasing differential ATAC regions located within SEs and TEs following ARID1A loss. The statistic is the 2-tailed Fisher’s exact test.
(O) Volcano plot displaying DE intergenic eRNA (n = 3,668) following ARID1A loss. Intergenic eRNA regions were selected from the 18,050 distal ATAC + H3K27ac peaks (Figure S1A), which did not overlap gene bodies and had detectable RNA. The x axis is log2FC upon ARID1A loss; the y axis is DE significance. Significant (p < 0.05) DE eRNA marked in red. The pie chart displays the ratio of intergenic eRNA significantly increasing or decreasing expression upon ARID1A loss.
(P) ARID1A binding at intergenic enhancer sites with decreasing (n = 83) or increasing (n = 74) eRNA expression. The statistic is the 2-tailed, unpaired Wilcoxon test.
(Q) Change (log2FC) in H3K27ac abundance at intergenic sites of increasing (n = 74) or decreasing (n = 83) eRNA expression following ARID1A loss. The statistic is the 2-tailed, unpaired Wilcoxon test.
(R) Change (log2FC) in eRNA expression at intergenic enhancer sites, with increasing (n = 577) or decreasing (n = 686) H3K27ac upon ARID1A loss. The statistic is the 2-tailed, unpaired Wilcoxon test.
*p < 0.05, **p < 0.01, and ***p < 0.001.
