
Figure 3. P300 and ARID1A Co-regulate H3K27ac at Highly Active SEs.
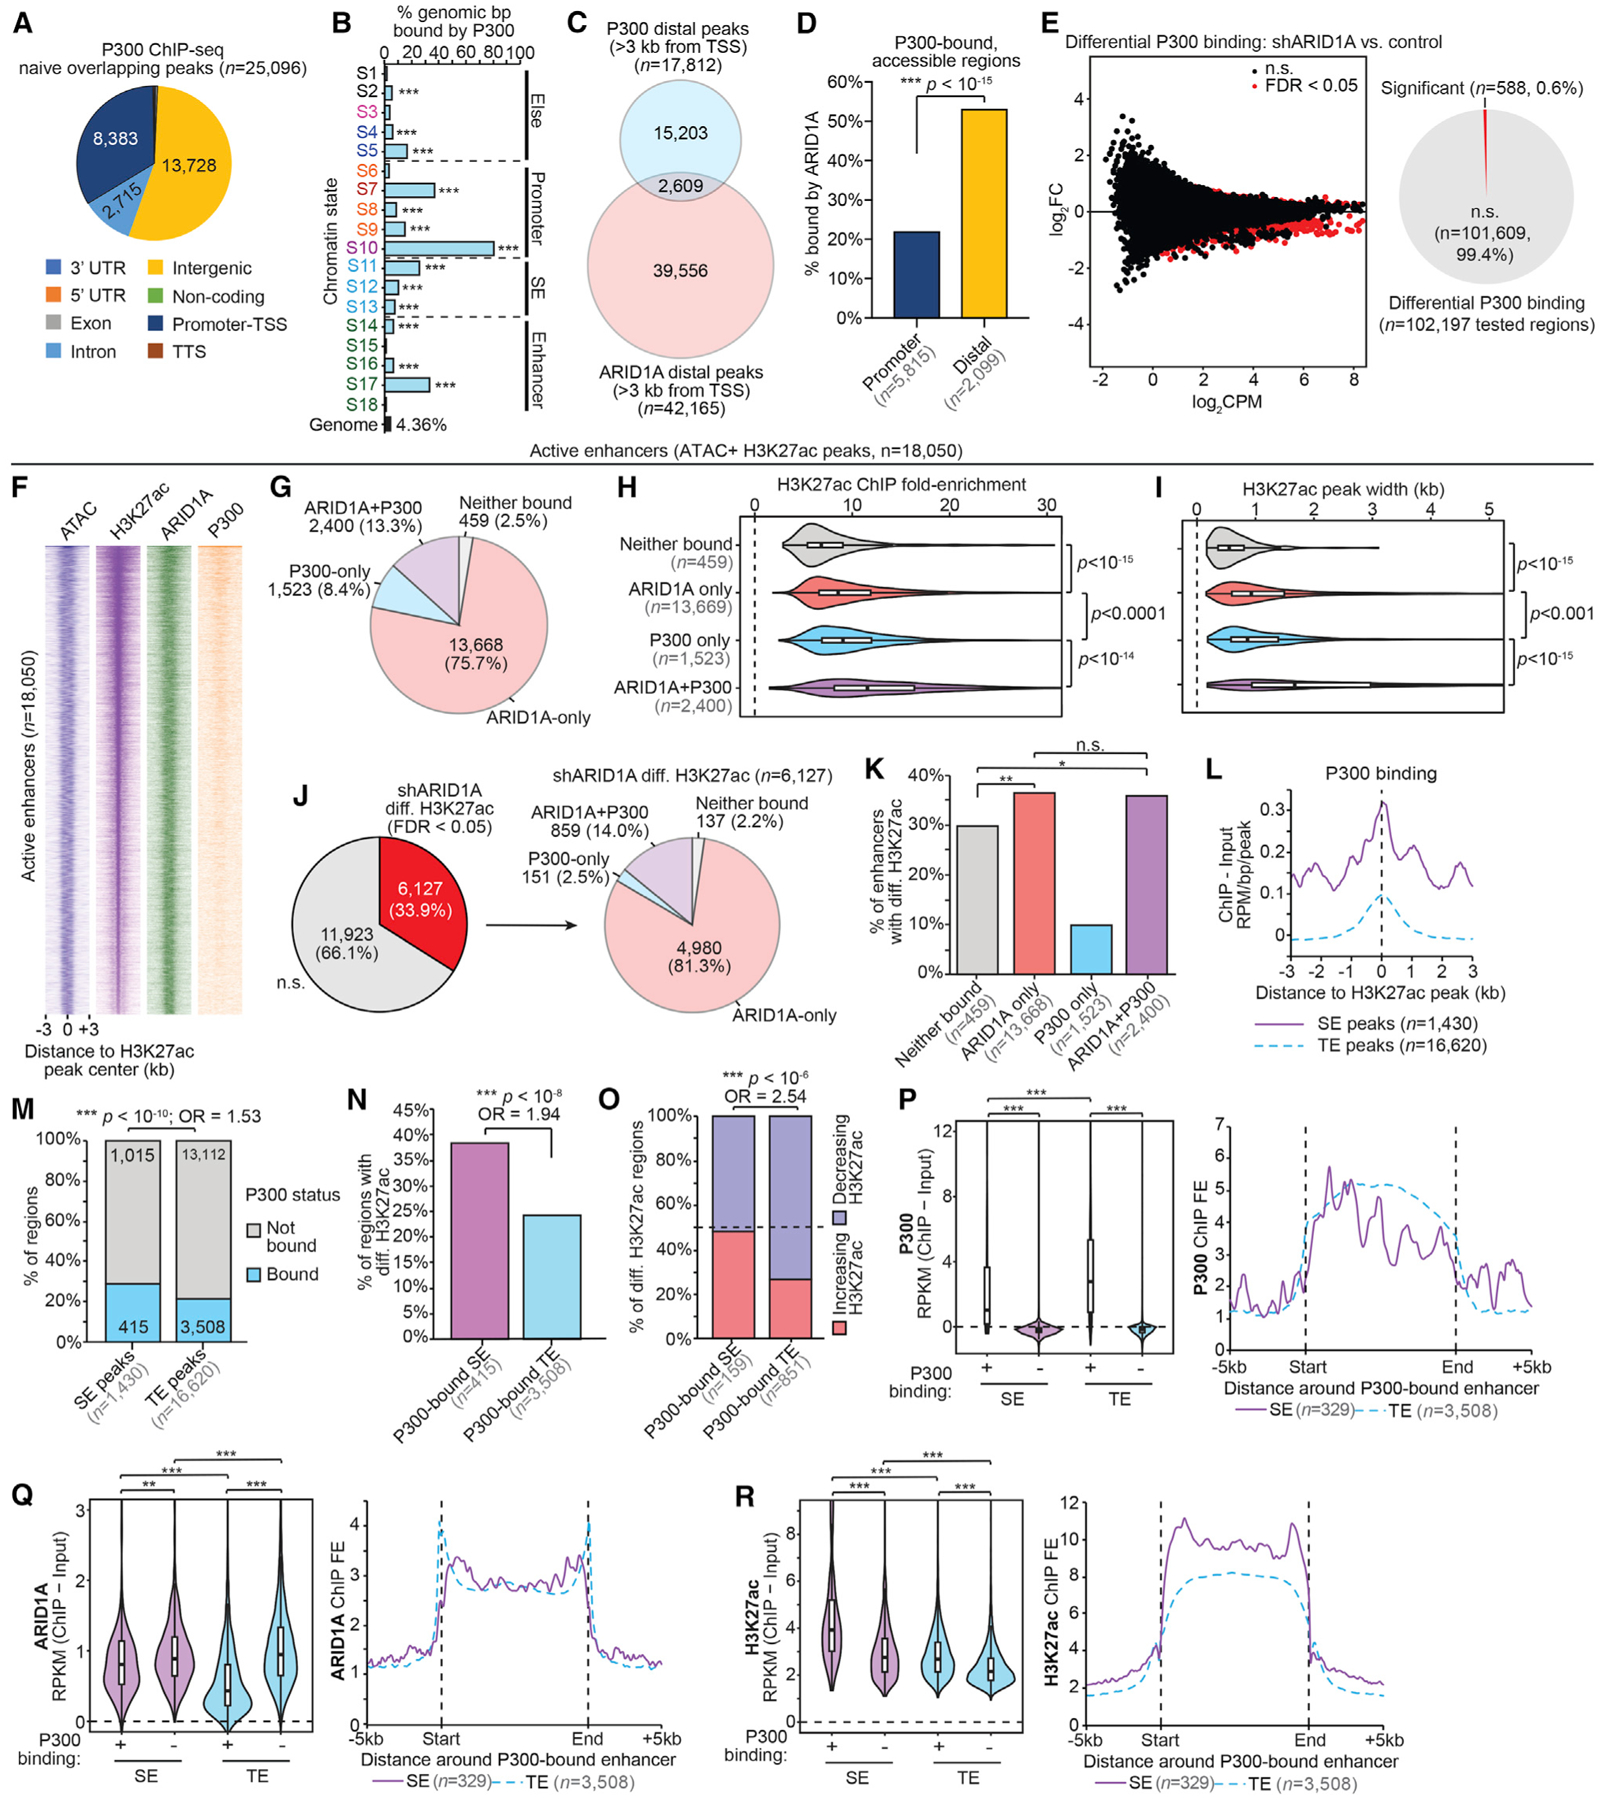
(A) Genomic annotation of replicate-overlapping P300 ChIP broad peaks in wild-type 12Z (FDR < 0.05, n = 25,096 peaks).
(B) Enrichment for P300 binding (control cells) among chromatin states compared to whole genome. The statistic is hypergeometric enrichment.
(C) Proportional Euler diagram displaying overlap between distal regions bound by ARID1A (n = 42,165) and P300 (wild-type cells, n = 17,812).
(D) ARID1A binding among accessible P300-bound sites. P300 bound sites (wild-type cells) were first segregated by promoter versus distal status, then filtered for accessibility (ATAC). The statistic is the 2-tailed Fisher’s exact test.
(E) Differential P300 ChIP-seq following ARID1A loss. At left is an MA plot revealing differential binding, with significant sites (FDR < 0.05) highlighted in red. The x axis is signal abundance quantified as log2 counts per million (log2CPM), and the y axis is the log2FC difference of P300 binding in shARID1A versus control conditions (n = 2 ChIP replicates). At right is the ratio of tested sites binned by differential binding significance. Further analyses of P300 binding use the control condition data (F–R).
(F) Signal heatmap displaying chromatin accessibility (ATAC), H3K27ac, and binding of ARID1A and P300 at enhancers (n = 18,050), centered on H3K27ac peak ± 3 kb. Enhancers were ranked by total H3K27ac signal.
(G) Proportion of active enhancers (n = 18,050) bound by ARID1A, P300, both, or neither.
(H) H3K27ac ChIP peak signal (fold enrichment, FE) relative to input at active enhancers segregated by ARID1A and P300 binding. The statistic is the 2-tailed, unpaired Wilcoxon test.
(I) H3K27ac ChIP peak width at active enhancers segregated by ARID1A and P300 binding. The statistic is the 2-tailed, unpaired Wilcoxon test.
(J) Ratio of enhancers (n = 18,050) displaying differential H3K27ac following ARID1A loss (left), and further segregation by ARID1A and P300 binding status (n = 4,681) (right).
(K) Proportion of differential H3K27ac regions among enhancers bound by ARID1A, P300, both, or neither. The statistic is the 2-tailed Fisher’s exact test.
(L) P300 ChIP signal at distal SE and TE H3K27ac peaks. The x axis is the distance to the H3K27ac peak center. The y axis is signal as ChIP – Input RPM per base pair per peak.
(M) Proportion of distal SE and TE H3K27ac peaks bound by P300. The statistic is the 2-tailed Fisher’s exact test.
(N) Proportion of P300-bound SE and TE regions displaying differential H3K27ac upon ARID1A loss. The statistic is the 2-tailed Fisher’s exact test.
(O) Proportion of increasing versus decreasing H3K27ac at differential SE and TE regions bound by P300. The statistic is the 2-tailed Fisher’s exact test.
(P–R) Violin plots (left) of ChIP signal for P300 (P), ARID1A (Q), and H3K27ac (R) at distal H3K27ac peaks in SE and TE regions further binned by P300 binding. Peak n’s from left to right: 415, 1,015, 3,508, and 13,112. The statistic is the 2-tailed, unpaired Wilcoxon test. Meta peak profiles (right) for P300 (P), ARID1A (Q), and H3K27ac (R) at P300-bound SE (entire SE region, n = 329) and P300-bound TE (n = 3,508).
*p < 0.05, **p < 0.01, and ***p < 0.001.