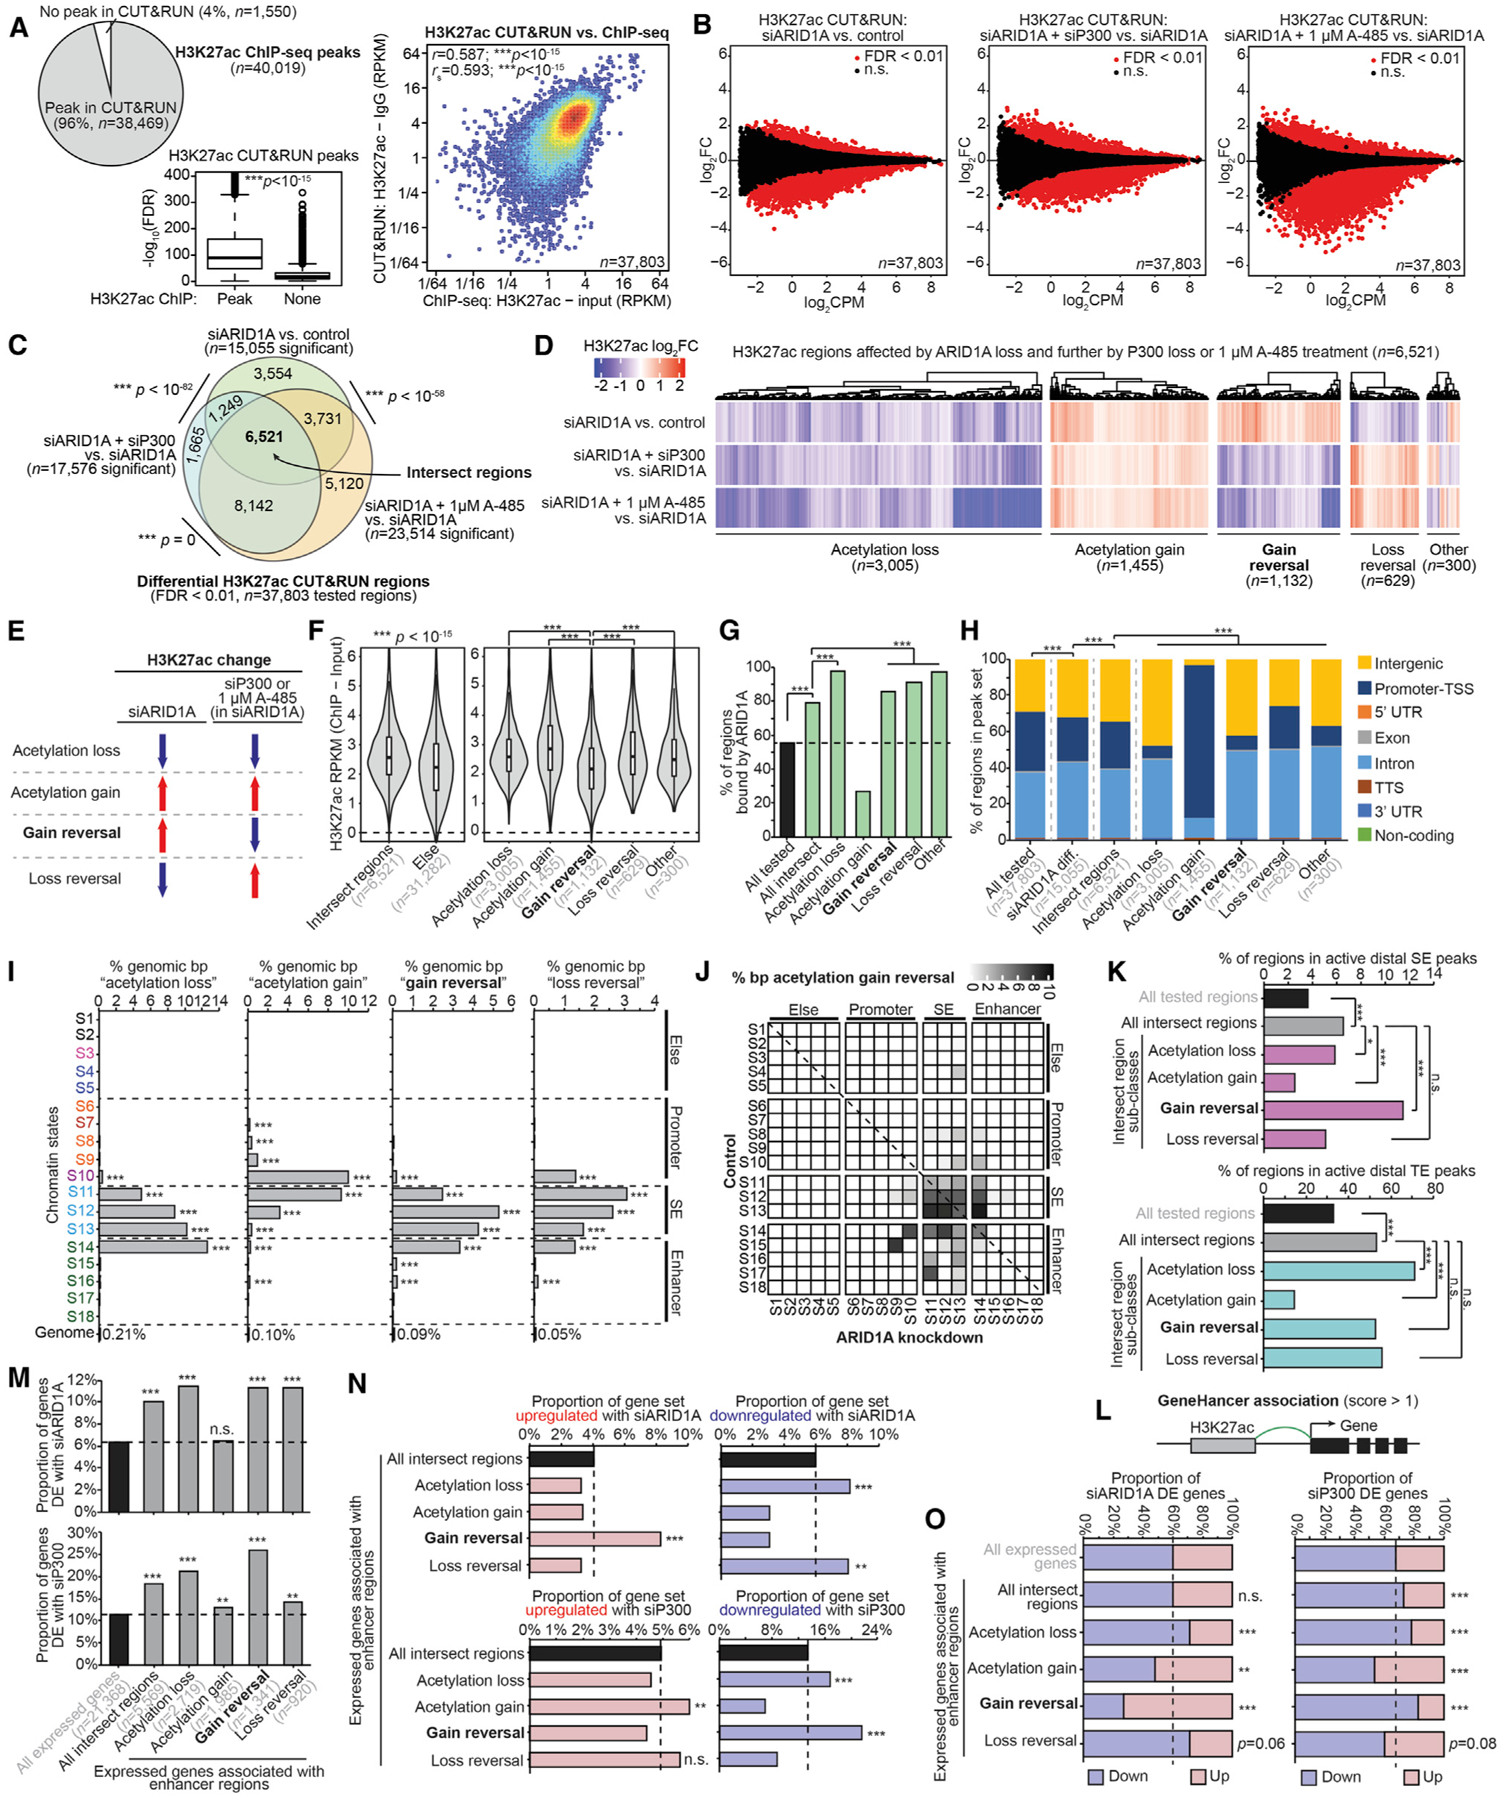
Figure 5. ARID1A Antagonizes P300 HAT Activity at a Subset of Active SEs.

(A) Comparison of H3K27ac CUT&RUN and ChIP-seq. Left, pie chart displaying theproportion of H3K27ac ChIP-seq replicate-overlapping peaks (n = 40,019) identified by CUT&RUN versus not identified. Center, CUT&RUN signal at replicate-overlapping peaks quantified by −log10(FDR), displayed as a boxplot in the style of Tukey with outliers. CUT&RUN peaks are further segregated by whether they were also identified by ChIP-seq. The statistic is an unpaired, 2-tailed Wilcoxon test. Right, correlation of CUT&RUN versus ChIP signal at 37,803 consensus peaks identified by ChIP used for differential analysis. RPKM signal values are further log2 transformed for plotting. The statistics are Pearson and Spearman correlations.
(B) MA plots for H3K27ac CUT&RUN comparisons: left, siARID1A versus control; center, siARID1A + siP300 versus siARID1A; right, siARID1A + 1 μM A-485 versus siARID1A. A total of 37,803 consensus peaks previously identified by H3K27ac ChIP were used for differential testing, and significant (FDR < 0.01) regions are marked in red.
(C) Proportional Euler diagrams displaying overlapping differential H3K27ac regions between the comparisons in (B). The statistic is hypergeometric enrichment.
(D) Clustering of H3K27ac log2FC values among 6,521 intersect regions (C). H3K27ac classes are defined by directionality patterns.
(E) Diagrammatic explanation of H3K27ac classes identified in (D). “Acetylation loss” sites (n = 3,005) display decreasing H3K27ac with siARID1A and further decrease with siP300 or 1 μM A-485 treatment. “Acetylation gain” sites (n = 1,455): increasing H3K27ac with siARID1A and further increase with siP300 or 1 μM A-485 treatment. “Gain reversal” sites (n = 1,132): increasing H3K27ac with siARID1A and decrease with further siP300 or 1 μM A-485 treatment. “Loss reversal” sites (n = 629): decreasing H3K27ac with siARID1A that increase with siP300 or 1 μM A-485 treatment.
(F) H3K27ac ChIP-seq signal quantification at intersect regions versus else, and the 5 intersect region classes defined in (D) and (E). Statistic is unpaired, 2-tailed Wilcoxon test.
(G) Genomic enrichment for ARID1A binding at H3K27ac intersect regions and subclasses. The statistic is hypergeometric enrichment.
(H) Genomic annotation of various H3K27ac regions and intersect subclasses. The statistic is chi-square.
(I) Genomic enrichment for H3K27ac intersect region classes at each chromatin state, compared to the whole genome. The statistic is hypergeometric enrichment.
(J) Map of chromatin state changes following ARID1A loss overlaid by the proportion of state-state base pairs displaying acetylation gain reversal as the color feature.
(K) Enrichment for H3K27ac intersect regions and subclasses at (top) active distal SE peaks and (bottom) active TE peaks. The statistic is hypergeometric enrichment.
(L) Diagram of GeneHancer database usage to associate H3K27ac enhancer regions with genes.
(M) Enrichment for differential gene expression following (top) siARID1A or (bottom) siP300 (in siARID1A cells) treatment among expressed genes associated with H3K27ac enhancer regions by GeneHancer. The statistic is hypergeometric enrichment.
(N) Enrichment for (left) upregulated versus (right) downregulated genes following (top) siARID1A versus (bottom) siP300 (in siARID1A cells) treatment among enhancer-associated genes as in (M). The statistic is hypergeometric enrichment.
(O) Distribution of upregulated versus downregulated genes in enhancer-associated gene classes as in (M) and (N) for (left) siARID1A or (right) siP300 (in siARID1A cells) DE genes. The statistic is hypergeometric enrichment.
