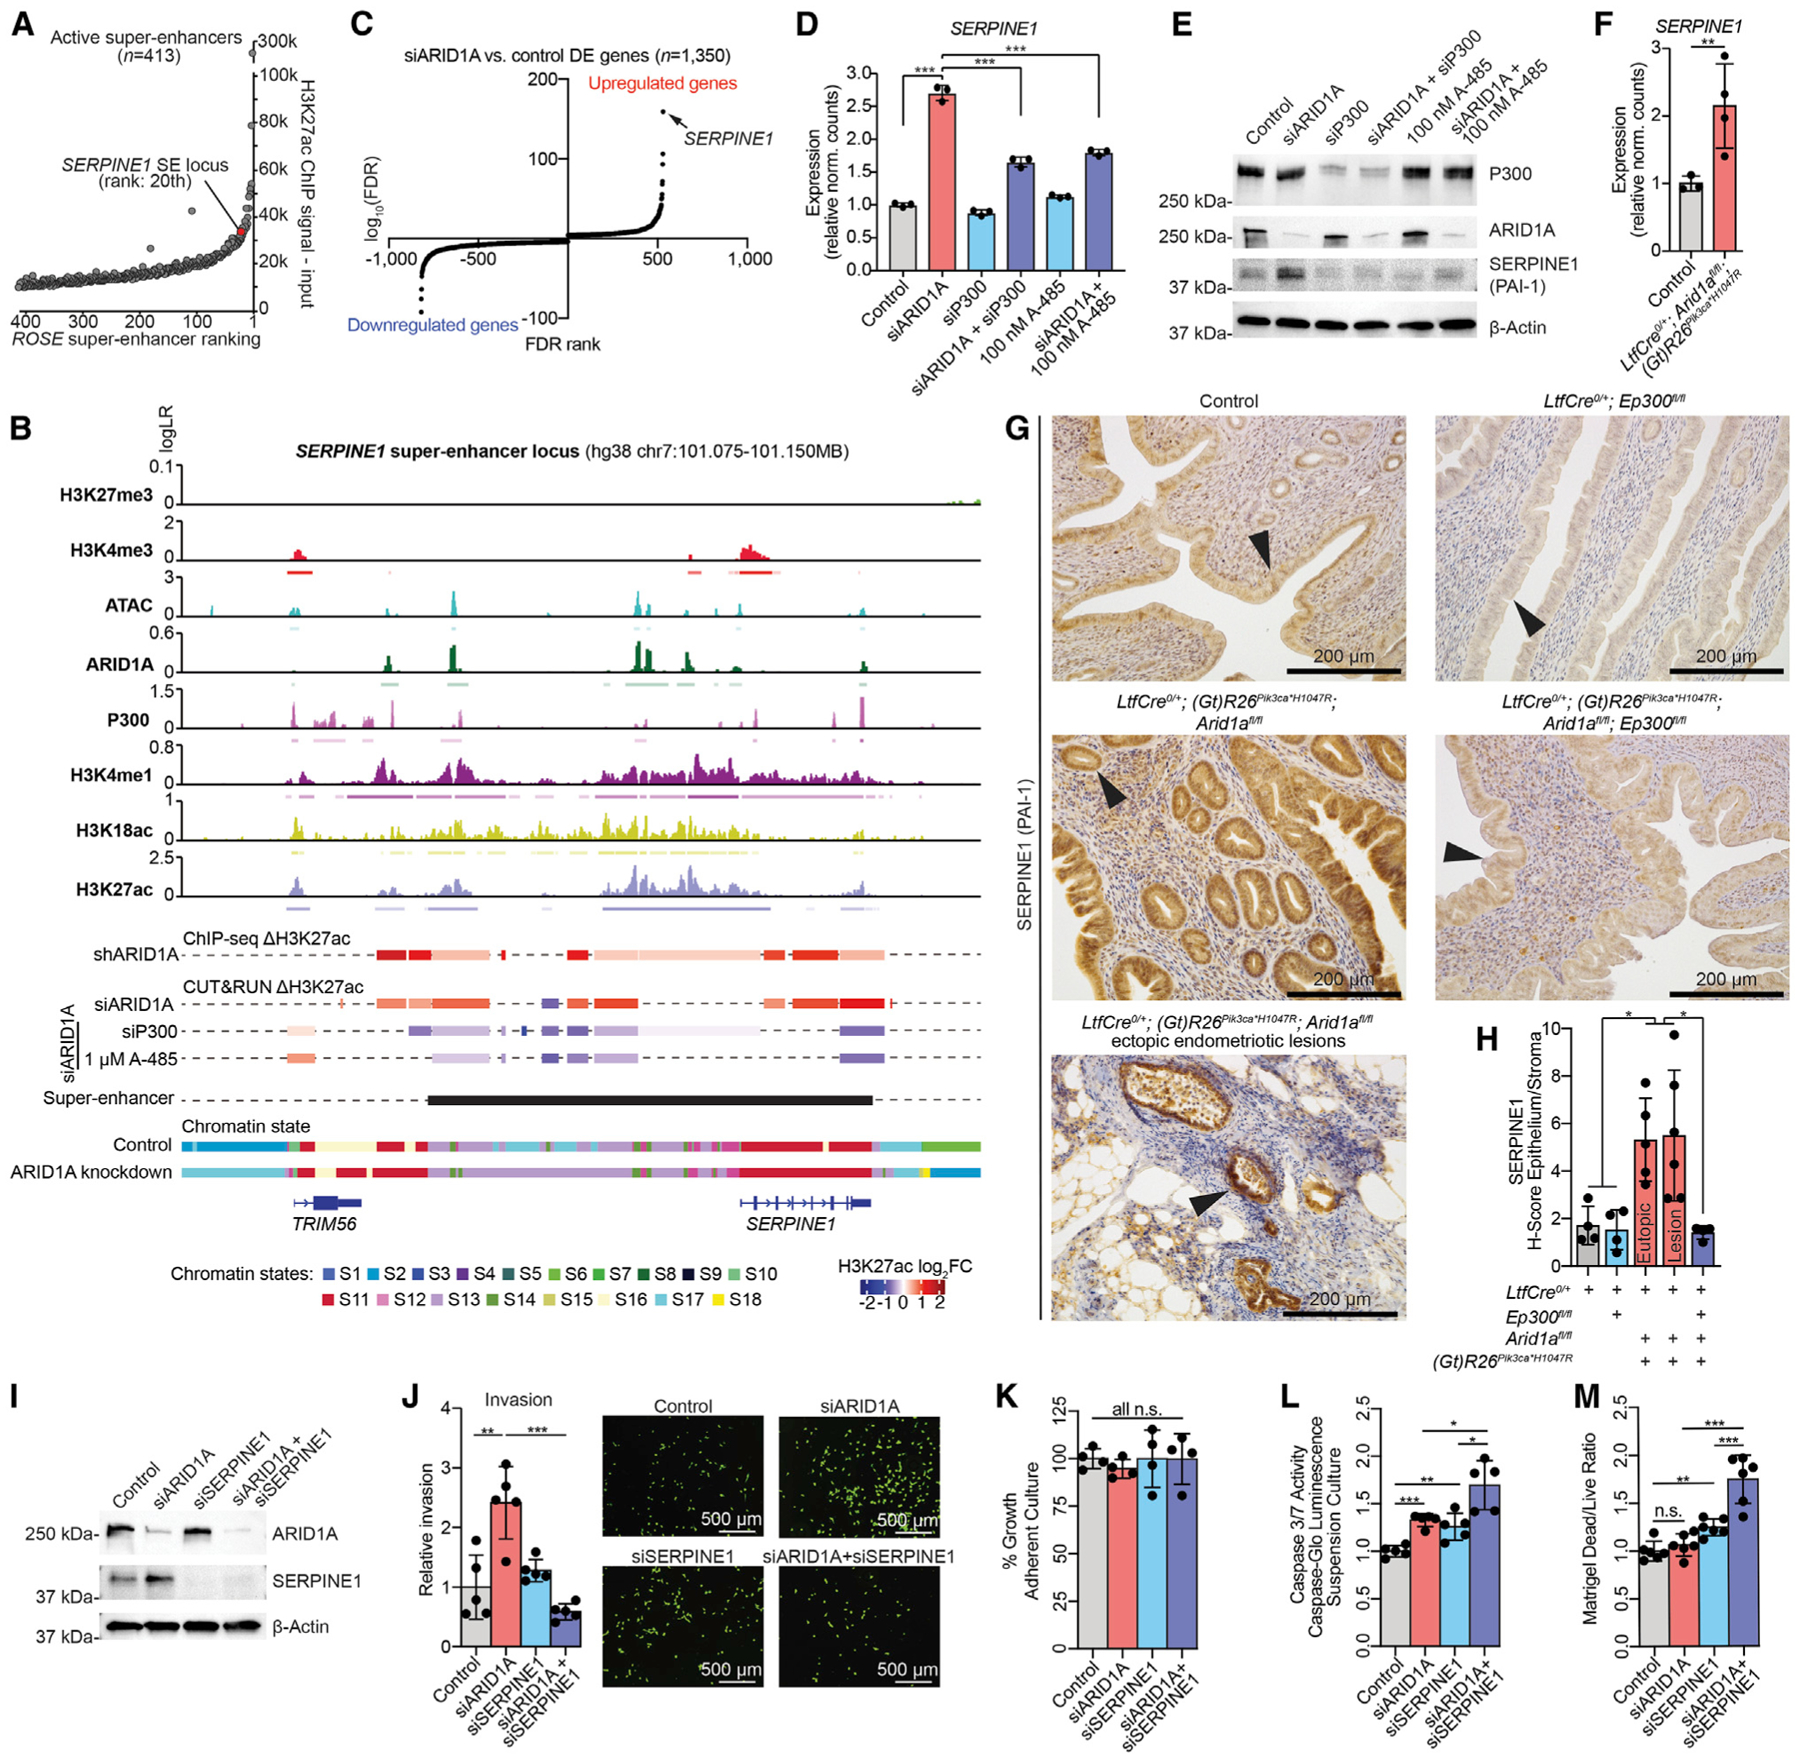
Figure 7. Hyperactivation of SERPINE1 SE Promotes ARID1A Mutant Cell Invasion.

(A) ROSE ranking of active SEs (n = 413). The SERPINE1 SE locus is ranked 20 out of 413 based on H3K27ac levels.
(B) Genomic snapshot of ChIP and ATAC signals alongside differential H3K27ac and chromatin state annotations at the SERPINE1 SE locus. For signal tracks, the y axis represents assay signal-to-noise presented as log-likelihood ratio (logLR) as reported by MACS2, and small bars below the tracks represent replicate-overlapping peaks. H3K27ac log2FC colored bars denote significant differential H3K27ac regions (FDR < 0.05 for ChIP, FDR < 0.01 for CUT&RUN). ROSE active SE locus is represented by the black bar.
(C) Significance (log10FDR, y axis) of DE genes following ARID1A loss, ranked by FDR value (x axis). SERPINE1 is the most significantly upregulated gene (arrow).
(D) Expression of SERPINE1 (RNA-seq) following indicated 12Z cell treatments. Means ± SDs, n = 3. The statistic is DESeq2 FDR.
(E) Western blot analysis as indicated in 12Z cells, representative of 2 independent experiments.
(F) Relative expression of SERPINE1 by RNA-seq. Means ± SDs, n = 3 control mice and n = 4 mutant mice. The statistic is DESeq2 FDR.
(G) IHC of SERPINE1 in endometrium of indicated genotypes; n = 4–5 mice per condition.
(H) Quantification of IHC staining, ratio of H-scores of epithelia to stroma. Means ± SDs, n = 4–5 mice, unpaired, 2-tailed t test.
(I) Western blot analysis as indicated in 12Z cells, representative of 2 independent experiments.
(J) Invasion of 12Z following indicated treatment. Representative images and total invaded cell numbers are shown (scale bar, 500 μm). Means ± SDs, n = 5, unpaired, 2-tailed t test.
(K) Measurement of cell growth following indicated treatments. Means ± SDs, n = 4. No significant differences, unpaired, 2-tailed t test.
(L) Caspase-Glo assay of 12Z in suspension following indicated treatments. Means ± SDs, n = 5, unpaired, 2-tailed t test.
(M) Ratio of dead to live cells after 24 h in Matrigel. Means ± SDs, n = 6, unpaired, 2-tailed t test.
*p < 0.05, **p < 0.01, and ***p < 0.001.
