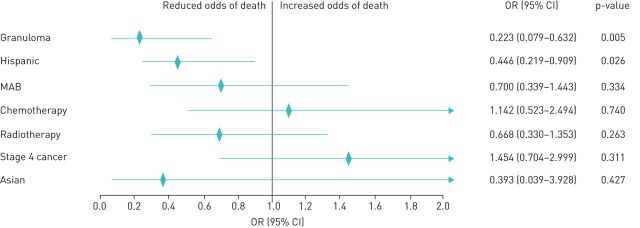
FIGURE 4.
Logistic regression with stepwise elimination for factors affecting survival; p-value from Hosmer and Lemeshow goodness-of-fit test=1.000. The rhombus shape indicates the odds ratio (OR), and the horizontal line indicates the confidence interval (CI). The arrow indicates that the 95% CI is outside the range shown. MAB: monoclonal antibody therapy.

