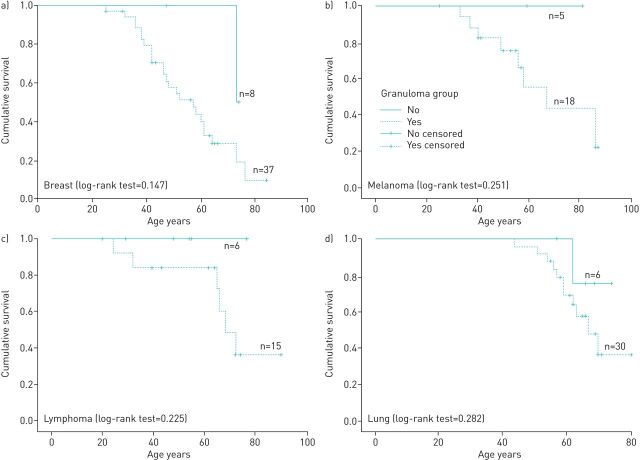
FIGURE 5.
Kaplan–Meier survival analysis showing the survival curve for the most common cancers among controls and cases. a) Breast cancer (granuloma=8, no granuloma=37, OR 0.55, 0.24–1.3); b) Melanoma (granuloma=5, no granuloma=18, OR 0.79, 0.27–2.25); c) Lymphoma (granuloma=6, no granuloma=15, OR 1.19, 0.43–3.28); d) Lung cancer (granuloma=6, no granuloma=30, OR 0.52, 0.2–1.34). The curves illustrate the proportion of subjects at each time point who were alive. The p-value was calculated by the log-rank test.

