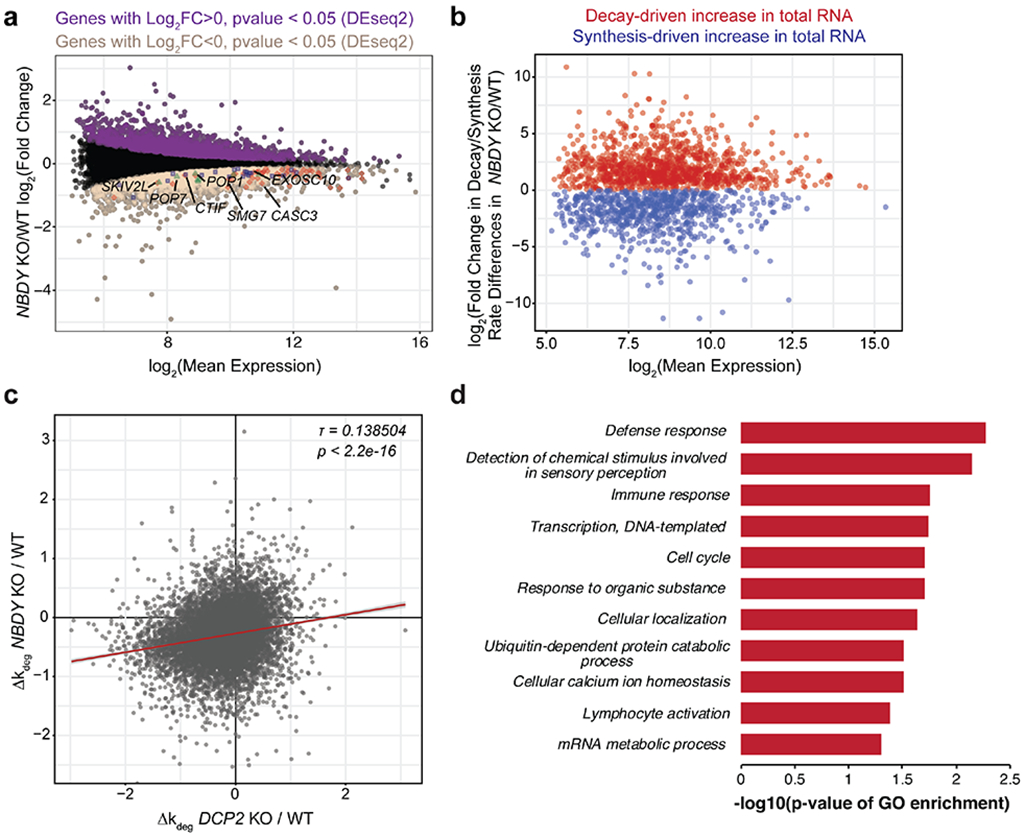
Figure 5 ∣. NBDY determines the stability of thousands of human transcripts.

(a,b) Profiling changes in RNA dynamics in NBDY KO versus wild type (WT) HEK 293T cells via metabolic labeling and TimeLapse-seq. The M (log ratio) A (mean average) plot indicates significantly upregulated (purple) and downregulated genes (sienna) derived from gene-level analysis of total RNAs (a). Decay- vs synthesis-driven dynamics were modeled in NBDY KO versus WT HEK 293T cells based on observed T-to-C mutation rates (b). In (a), synthesis downregulated RNA decay machineries were highlighted; Red, nonsense-mediated decay; blue, miRNA-mediated decay; green, endonucleolytic decay. (c) NBDY and DCP2 globally regulate the stability of overlapping sets of RNAs, as shown by moderate correlation between the changes in estimated RNA degradation rate in each KO relative to WT cells (Kendall tau rank correlation coefficient τ=0.138504, p < 2.2e-16). (d) Significant biological process GO Slim terms of post-transcriptionally stabilized genes in NBDY KO versus WT HEK 293T cells. Fisher’s exact test was performed using PANTHER overrepresentation test with FDR<0.05.
