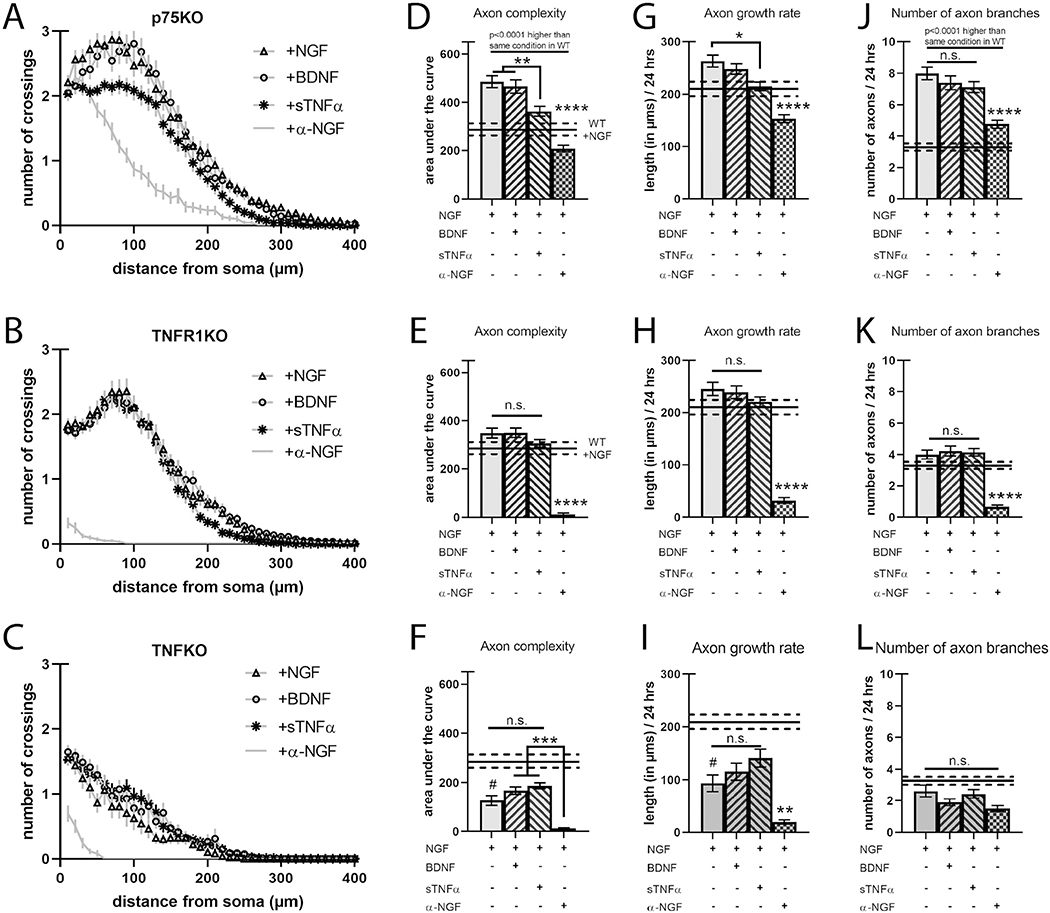
Fig. 2.
Loss of TNFR1 does not alter axon complexity but is required for BDNF-dependent decrease in axon length.
A–C) Sholl analysis of SCG neurons cultured as in Fig. 1 but from p75KO, TNFR1KO, and TNFKO, respectively. D–F) Quantification of the area under the curve from A–C, respectively. G–I) Axon growth rate was measured as the length of the longest axon segment per neuron after 24 h from A–C, respectively. J–L) Axon branching was measured as the number of axon branch endpoints per neuron after 24 h from A–C, respectively. Solid black bars represent the mean axon characteristics displayed by neurons from wild-type animals treated with NGF with the dotted lines representing the s.e.m. shown in Fig. 1 and here for comparison. Full statistical comparisons found in STable 1. Error bars represent s.e.m. n = 50 to 120 neurons per condition from 3 cultures of SCGs pooled from whole litters for each genotype. n.s. = not significant, #p < 0.005 (between wild-type +NGF and TNFKO +NGF), *p < 0.05, ****p < 0.0001 using 2-way ANOVA with Tukey’s multiple comparisons test.

