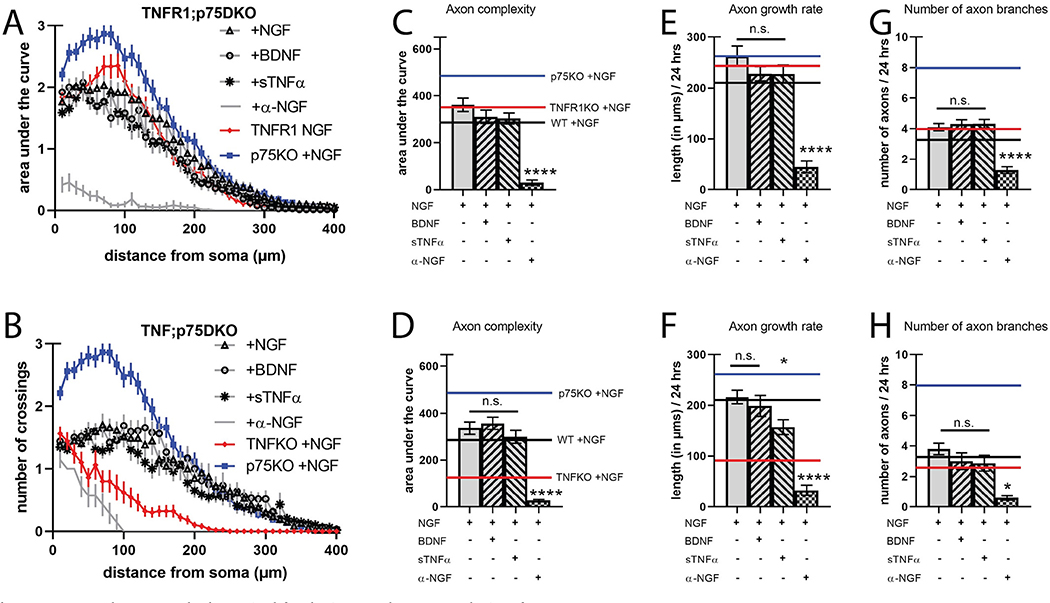
Fig. 4.
TNFR1 and TNFα are both required for the increased axon complexity of p75KO neurons.
A, B) Sholl analysis of SCG neurons cultured as in Fig. 1 but from TNFR1;p75DKO, and TNF;p75DKO, respectively. C, D) Quantification of the area under the curve from A, B, respectively. E, F) Axon growth rate was measured as the length of the longest axon segment per neuron after 24 h from A–B, respectively. G, H) Axon branching was measured as the number of axon branch endpoints per neuron after 24 h from A–B, respectively. Solid black bars represent axon characteristics displayed by neurons from wild-type animals treated with NGF shown in Fig. 1 for comparison. The red line indicates TNFR1KO (in A, C, E, G), and TNFKO (in B, D, F, H), both +NGF, and the blue line indicates p75KO + NGF for comparison. For clarity, the s.e.m. was not represented. Full statistical comparisons found in STable 1. Error bars represent s.e.m. n = 27 to 82 neurons per condition from 3 cultures of SCGs pooled from whole litters for each genotype. n.s. = not significant, *p < 0.05, ****p < 0.0001 using 2-way ANOVA with Tukey’s multiple comparisons test. (For interpretation of the references to colour in this figure legend, the reader is referred to the web version of this article.)

