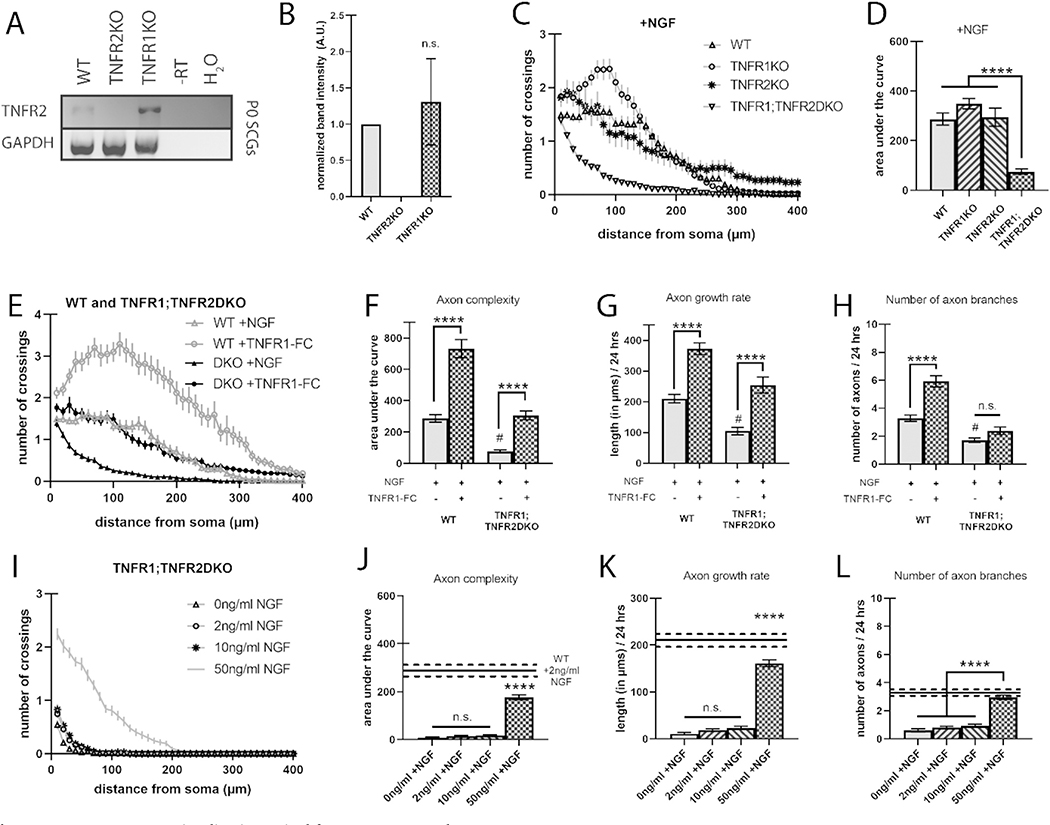
Fig. 5.
TNFR-TNFα reverse signaling is required for NGF axon growth.
A) Representative RT-PCR showing expression of TNFR2 mRNA in SCG neurons derived from pooled P0 wild-type, TNFR1KO, and TNFR2KO litters. B) Relative TNFR2 mRNA expression as measured by RT-PCR from 3 separate pooled litters per genotype; SFig. 2 shows the RT-PCR from all 3 blots. C) Sholl analysis of TNFR2KO SCG neurons grown with 2 ng/ml NGF and compared to wild-type and TNFR1KO neurons from Figs. 1 and 2, respectively. D) Quantification of the area under the curve from C. E) Sholl analysis of wild-type or TNFR1;TNFR2DKO SCG neurons grown with 2 ng/ml NGF and in the presence or absence of 10 ng/ml TNFR1-Fc, soluble extracellular TNFR1 peptide. F) Quantification of the area under the curve from E. G) Axon growth rate was measured as the length of the longest axon segment per neuron after 24 h from E. H) Axon branching was measured as the number of axon branch endpoints per neuron after 24 h from E. I) Sholl analysis of TNFR1;TNFR2DKO SCG neurons grown in 0, 2, 10, and 50 ng/ml NGF. J) Quantification of the area under the curve from I. K) Axon growth rate was measured as the length of the longest axon segment per neuron after 24 h from I. L) Axon branching was measured as the number of axon branch endpoints per neuron after 24 h from I. Full statistical comparisons found in STables 2, 3, and 4. Error bars represent s.e.m. n = 52 to 107 neurons per condition from 3 cultures of SCGs pooled from whole litters for each genotype. n.s. = not significant, #p < 0.0001 (between wild-type +NGF and TNFR1;TNFR2DKO + NGF), ****p < 0.0001 using 1-way ANOVA for B-D and I-L and 2-way ANOVA for E–H all with Tukey’s multiple comparisons test.

