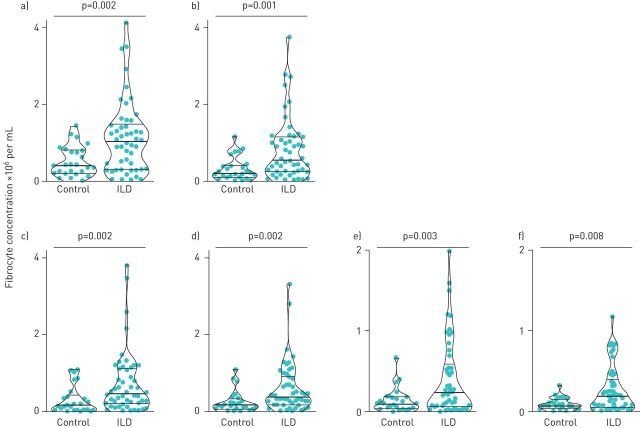
FIGURE 2.
Cross-sectional comparison of circulating fibrocyte concentration in subjects with autoimmune interstitial lung disease (ILD) and healthy controls. a) Total circulating fibrocytes (CD45+ Col1+ cells); b) activated fibrocytes (CD45+ Col1+ ɑSMA+ cells); c–f) fibrocytes staining for phosphorylated Smad-2/3, AKT-1, P70SK6 and STAT6, respectively. Each dot represents one subject; bold horizontal lines in the violin plots show the median and light horizontal lines represent the 25th and 75th percentiles.

