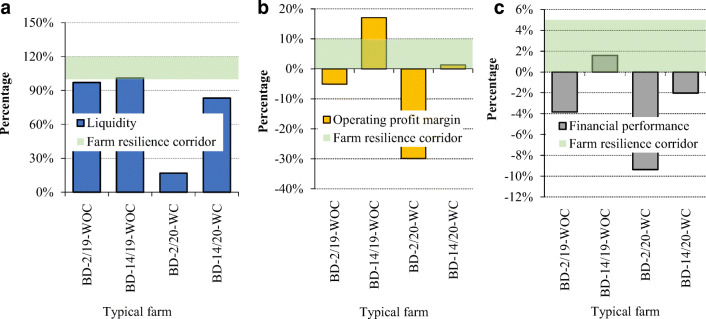
Fig. 4.
a Liquidity of dairy farms. This figure describes the resilience of dairy farms based on liquidity. b Buffer capacity: operating profit margin. This figure describes the resilience of dairy farms considering the operating profit margin. c Financial performance of dairy farms. This figure describes the resilience of dairy farms due to the change in financial performance

