
Figure 1.
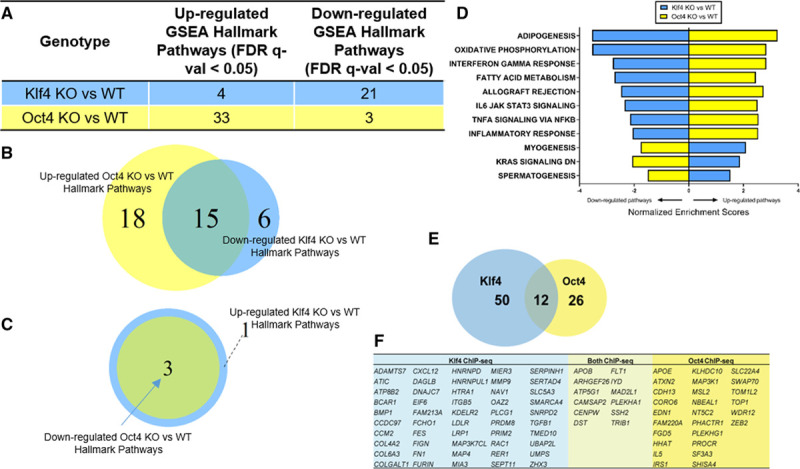
Bulk RNA-seq and SMCOct4 and SMCKlf4 ChIP-seq analysis of advanced BCA lesion areas from SMC-specific Klf4 vs Oct4 knockout apoE-/- mice showed virtually opposite genomic signatures and identify candidate SMC Klf4 or Oct4 target genes that may play an important role in late-stage atherosclerotic lesion pathogenesis. RNA-seq was performed on the BCA regions from 18-week Western diet–fed SMCKlf4-Δ/Δ vs SMCKlf4-WT/WT and SMCOct4-Δ/Δ vs SMCOct4-WT/WT mice. A, GSEA analysis showing MSigDB Hallmark pathways from comparing KO vs WT of both lines are shown. B, Venn diagram showing the common pathways between downregulated SMCKlf4-Δ/Δ vs SMCKlf4-WT/WT and upregulated in SMCOct4-Δ/Δ vs SMCOct4-WT/WT. C, Venn diagram showing the common pathways between upregulated SMCKlf4-Δ/Δ vs SMCKlf4-WT/WT and downregulated in SMCOct4-Δ/Δ vs SMCOct4-WT/WT. D, Bar graph showing the top 8 common pathways from B and all common pathways in C differentially regulated pathways between SMCKlf4-Δ/Δ vs SMCKlf4-WT/WT and SMCOct4-Δ/Δ vs SMCOct4-WT/WT analyses. E, ChIP-seq was done on the BCA regions from 18-week Western diet–fed SMCKlf4-Δ/Δ vs SMCKlf4-WT/WT and SMCOct4-Δ/Δ vs SMCOct4-WT/WT mice (n=15). The Venn diagram shows overlap of putative “closest gene” binding partners of Klf4 and Oct4 in SMC (ie, those binding partners that are lost in the SMCKlf4-Δ/Δ compared with SMCKlf4-WT/WT) that are also human CAD GWAS loci. P value of gene overlap <0.01. F, Table showing genes present in the Venn diagram in E. BCA indicates brachiocephalic artery; CAD, coronary artery disease; ChIP-seq, chromatin immunoprecipitation sequencing; FDR, false discovery rate; GSEA, gene set enrichment analysis; GWAS, genome-wide association study; KO, knockout; RNA-seq, RNA sequencing; SMC, smooth muscle cell; and WT, wild-type.