
Figure 2.
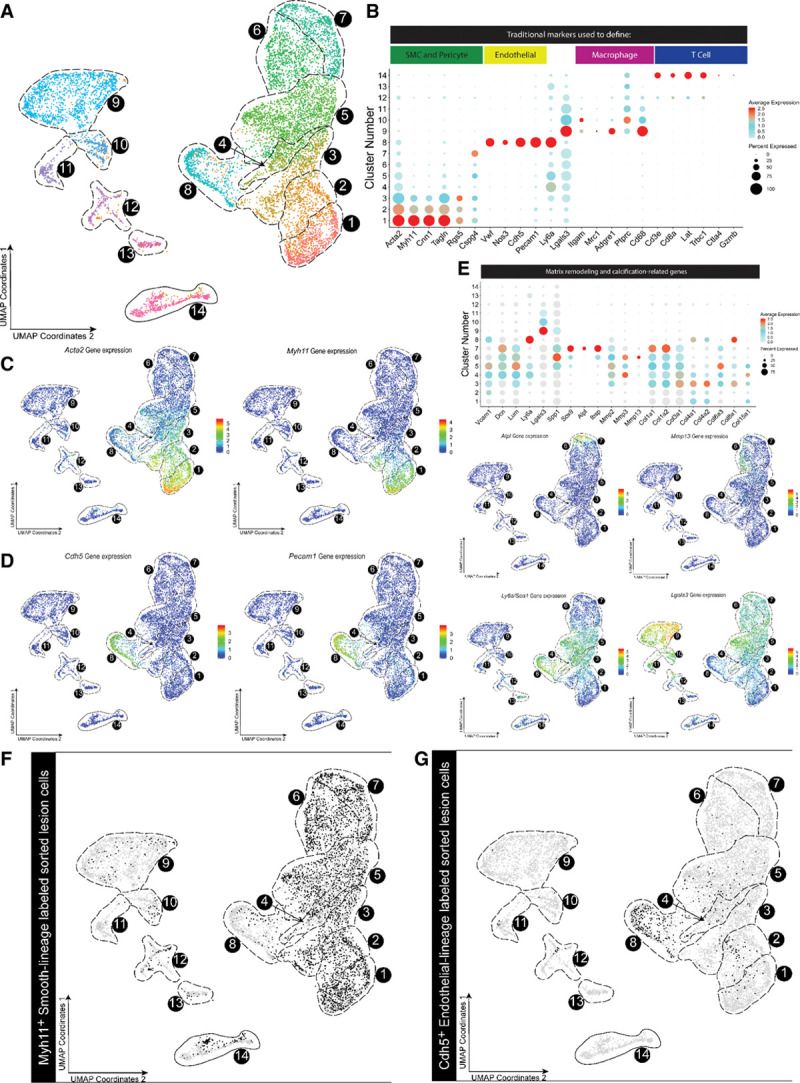
scRNA-seq analysis of healthy aorta and advanced BCA lesions identified 14 distinct cell clusters including 7 predominately of SMC origin. A, Cells were harvested for scRNA-seq from microdissected advanced BCA lesions from SMC lineage-traced (Myh11-CreERT2 Rosa-eYFP apoE-/-) or endothelial lineage-traced (Cdh5-CreERT2 Rosa-eYFP apoE-/-) 18-week Western diet–fed mice, as well as healthy 8-week-old apoE-/- SMC lineage-traced mouse aorta as a control. In aggregate, these data are the results of 7 experiments, 19 Chromium 10X libraries, and 23 mice. Results are shown as a UMAP colored by cluster. B, Dot plot of traditional markers used for cell identity. Cand D, Feature plots showing gene expression of Myh11, Acta2 (C) and Cdh5 and Pecam1 (D), as representative genes of classical markers for SMC and endothelial cells, respectively. Myh11 was detected only in clusters 1 to 2, whereas Cdh5 was detected exclusively in cluster 8. E, Dot plots and feature plots of selected genes representing 3 SMC phenotypic groups, stem/inflammatory, ECM remodeling, and osteogenic. Further plots and pathway analysis justifying the groups can be found in Figures V and VI in the Data Supplement. FandG, UMAP of mouse cells showing (F) Myh11-CreERT2 Rosa-eYFP apoE-/- (black dots) or (G) Cdh5-CreERT2 Rosa-eYFP apoE-/-lineage-traced cells from BCA plaques of mice fed a Western diet for 18 weeks (black dots). BCA indicates brachiocephalic artery; scRNA-seq, single-cell RNA sequencing; SMC, smooth muscle cell; and UMAP, uniform manifold approximation and projection.