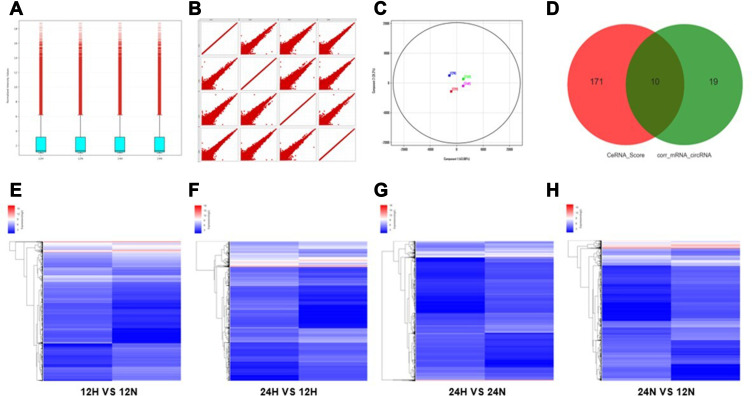
Figure 2.
Differential gene screening of microarray and ceRNA analysis. (A) Box-whisker plot: minimum, first quartile (25%), median (50%), third quartile (75%) and the maximum value were used to analyze the symmetry and the degree of dispersion of the distribution. (B) Scatter plot: evaluate the overall distribution and concentration trend of multiple sets of data. (C) Principal component analysis: to examine the distribution of samples to verify the rationality of the experimental design and the uniformity of biological duplicate samples. (D) Correlation pairs of circRNA and mRNA were calculated by correlation of expression values. Use this information to further filter the ceRNA predicted by the ceRNA score method. (E–H) Clustering: Unsupervised hierarchical clustering of differentially expressed genes and displayed in heatmap. (12H, 12N, 24H and 24N represents 12 hours for hypoxia, 12 hours for normoxia, 24 hours for hypoxia and 24 hours for normoxia, respectively.).

