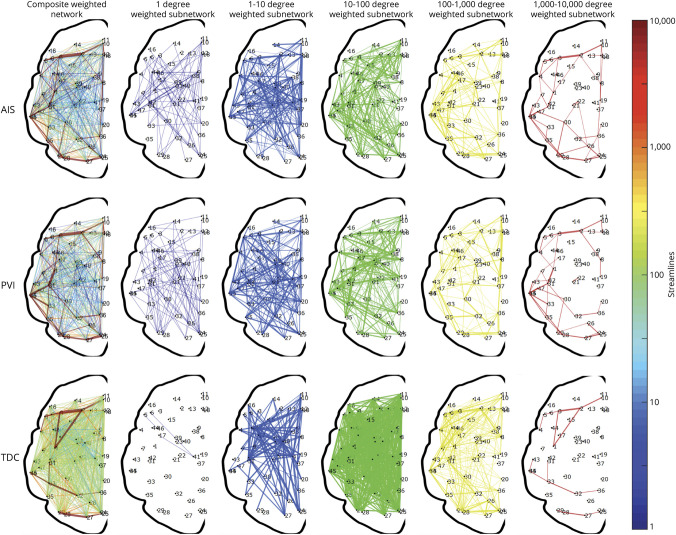
Figure 3. Visual representation of the weighted, undirected networks for a random child selected from the arterial ischemic stroke (AIS), periventricular venous infarction (PVI), and typically developing control (TDC) groups.
The weighted, undirected networks for each child is presented as both a composite graph (far left column) and segregated subnetworks based on network degree. Each subnetwork is displayed for node degrees ndegree = 10x for x = 0,1,…,5. Exponential steps between node degrees provide an appropriate visualization across the total number of streamlines representing each graph.

