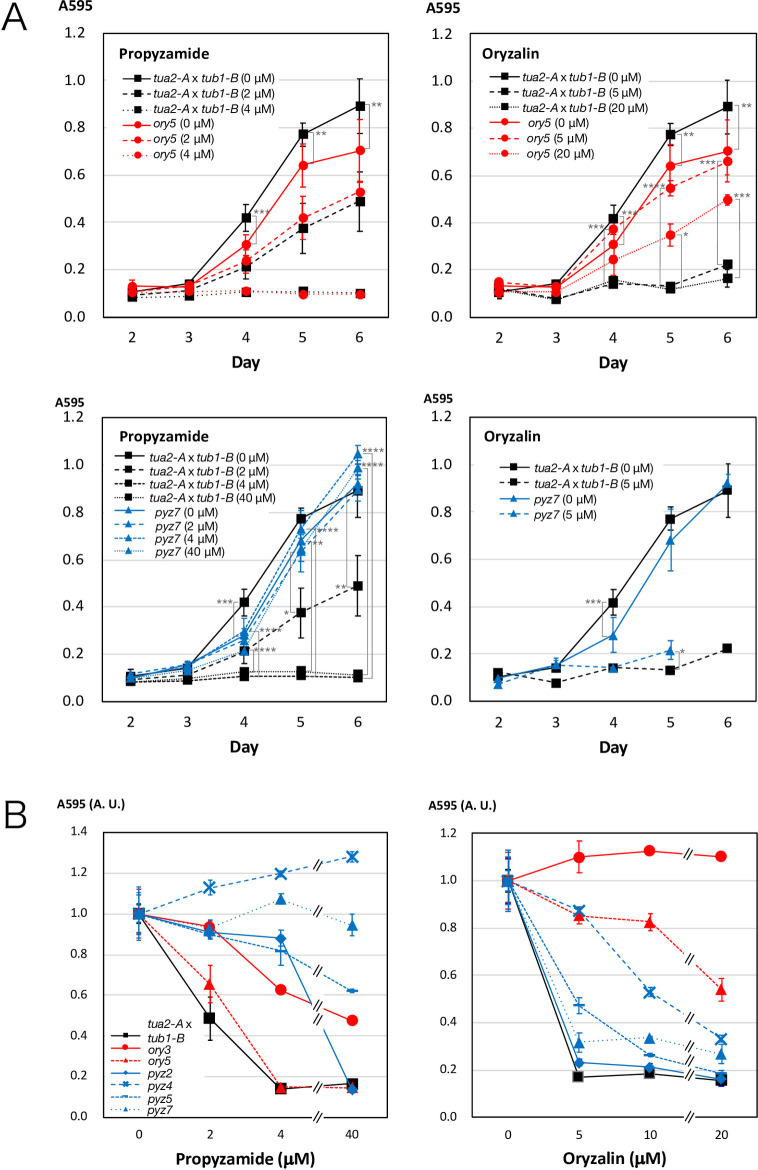
Fig 7. Growth profiles of representative missense mutants in the presence of propyzamide and oryzalin.
Cells were cultured in growth medium containing different concentrations of propyzamide and oryzalin. Absorbance of the culture was measured at 595 nm every day. Error bars represent standard deviations in three independent measurements. (A) Growth curves of two representative strains, ory5 and pyz7, compared with the parent strain tua2-A x tub1-B at two or three concentrations of drugs. ory5 is resistant to oryzalin but not to propyzamide. In contrast, pyz7 is resistant to propyzamide but not to oryzalin. *, P<0.05; **, P<0.01; ***, P<0.0001; ****, P<0.00001 (ANOVA test). (B) Relative optical densities 5 days after the initiation of culture are plotted against the concentration of propyzamide or oryzalin. Seven strains, ory3, ory5, pyz2, pyz4, pyz5, pyz7, and the parent strain tua2-A x tub1-B are compared. Optical densities at 0 concentration are normalized to 1.

