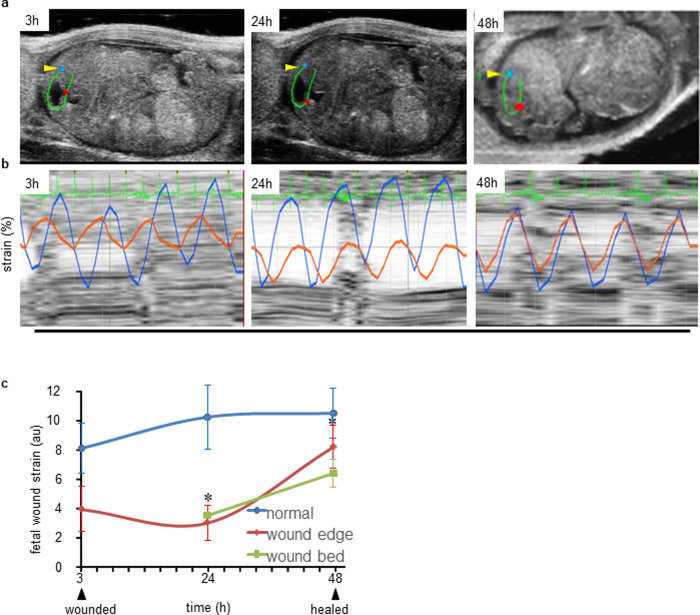
Fig 4. Noninvasive measurement of fetal cutaneous wound tissue stiffness.
(a) Region selected for fetal wound edge (red dot) and surrounding un-wounded skin (blue dot) to analyze biomechanical strain. A line was traced (green) around the wound site to help select the analysis sites using ‘Vevo Strain®’ software. (b) Strain curves of edge (red) and surrounding unwounded skin (blue) at different time intervals (3, 24 & 48h) post-wounding. (c) Fetal wound strain of wound edge, wound bed and normal skin was computed from the red, light green and blue curves respectively and the line graph was plotted over time (3h-48h for normal skin and wound edge and 24h-48h for wound bed). The standard error of mean of wound bed at time points 24h, and 48h are 0.001, and 0.001) respectively. Data represented as the mean ± SE, n = 3. *p< 0.05.

