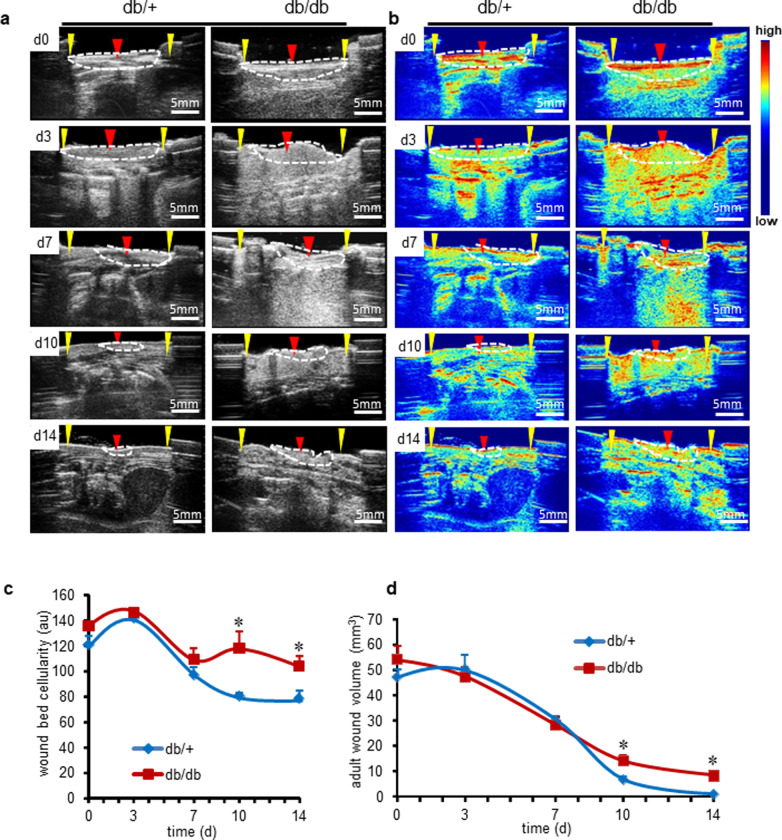
Fig 5. Morphometry of adult diabetic cutaneous wound healing compared to the non-diabetic mice.
(a) Ultrasound B-mode image of full thickness stented wounds (d0,3,7,10,14) wound bed (red arrow, white dotted region), wound edge (yellow arrows) of db/db and control db/+ mice (b) Enhanced anatomical images using Matlab code to show the cellular density. Scale bar = 5 mm. Density index low (blue) to high (red) (c) Quantification of wound bed tissue cellularity over time in db/db and corresponding db/+ control. Data represented as the mean ± SE, n = 6. *p< 0.05. (d) Quantification of adult cutaneous wound volume over time. Data represented as the mean ± SE, n = 6. *p< 0.05.

