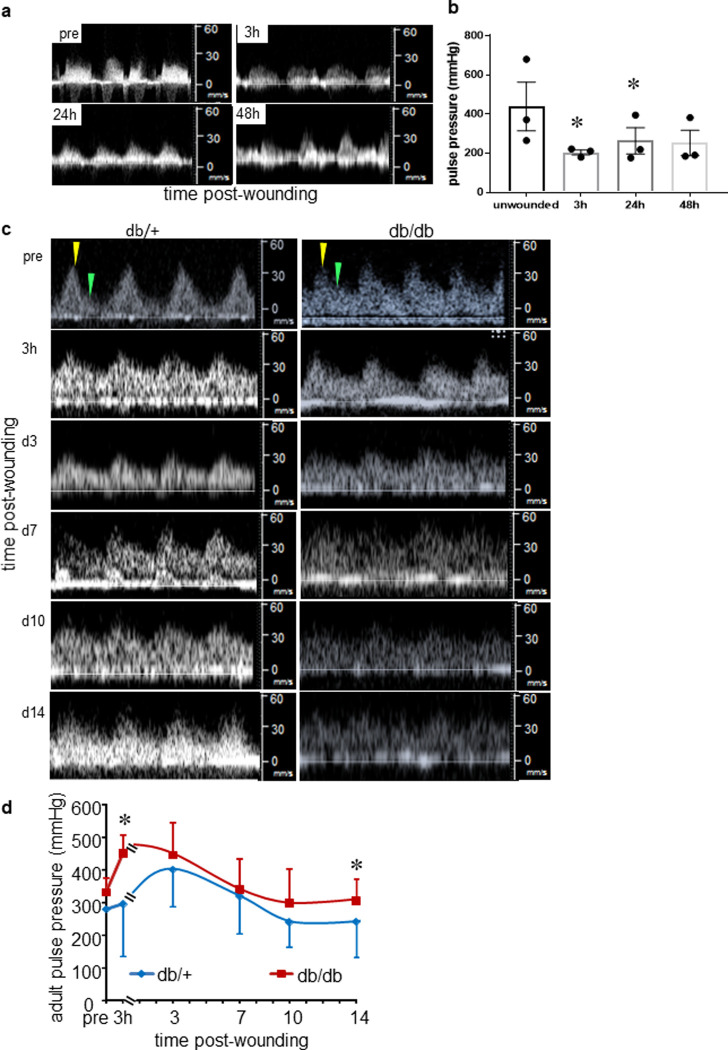
Fig 7. Hemodynamics of fetal and adult cutaneous wound feeder vessels.
(a) Pulsed Doppler blood flow velocity profile of fetal cutaneous wounds at 3-, 24- and 48-hours post-wounding compared with pre-wounding condition. (b) Pulse pressure of feeder vessels unwounded and post-wounding plotted over time. Data presented as the mean ± SE. n = 3, *p< 0.05 compared to 3h. (c) Representative Doppler ultrasound images depicting blood flow in feeder vessel of adult cutaneous wound, db/+ (left panel) and db/db (right panel). Systolic peak shown with yellow arrow, diastolic peak shown in green. (d) Adult wound feeder artery pulse pressure db/+ (blue) and db/db (red) plotted as line graph over time. The comparison of pulse pressure was made between db/+ (blue line) and db/db (red line) at different time points. Data represented as the mean ± SE. n = 6. *, p< 0.05.

