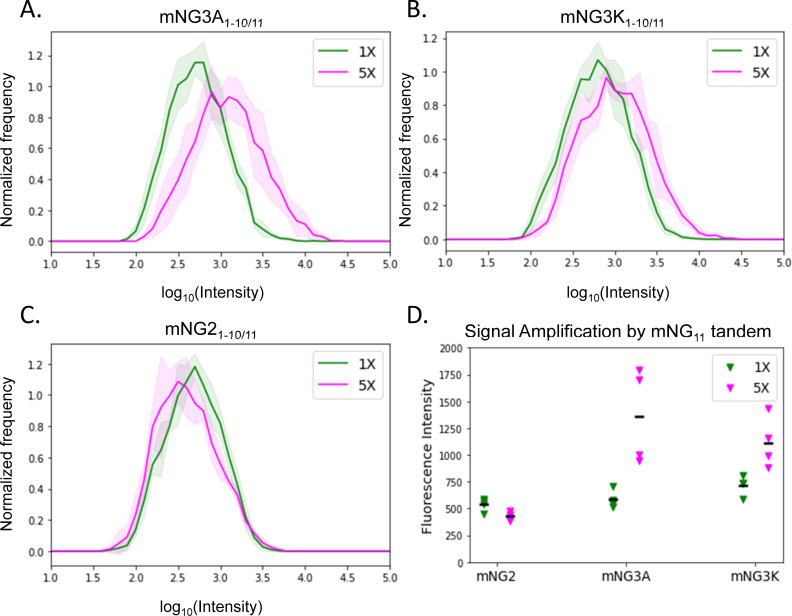
Fig 4. Significant signal amplification by tandem mNG211 with mNG3A1-10 and mNG3K1-10.
A-C. Fluorescence intensity distribution of individual cells transiently co-transfected with FP11 (1x mNG211 in green or 5x mNG211 in pink) and FP1-10 (mNG21-10, mNG3A1-10 or mNG3K1-10), each condition has four replicates, solid lines show the mean of four distributions, the shadow indicates standard deviation. Representative images of the cells are shown in S4 and S5 Figs in S1 File. D. Each marker shows the median nuclear intensity for a field of view represented in A-C. Bars indicate the mean of all fields. Increased signal for mNG3A and mNG3K using 5x mNG211 is statistically significant (Welch’s t-test).

