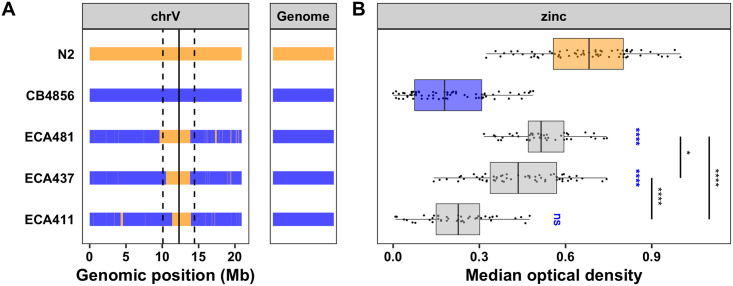
Fig 2. NILs identify multiple QTL on chromosome V.
(A) Strain genotypes are shown as colored rectangles (N2: orange, CB4856: blue) in detail for chromosome V (left) and in general for the rest of the chromosomes (right). The solid vertical line represents the peak marker of the QTL, and the dashed vertical lines represent the confidence interval. (B) Normalized residual median optical density in zinc (median.EXT, x-axis) is plotted as Tukey box plots against strain (y-axis). Statistical significance of each NIL compared to CB4856 is shown above each strain (ns = non-significant (p-value > 0.05); *, **, ***, and *** = significant (p-value < 0.05, 0.01, 0.001, or 0.0001, respectively).

