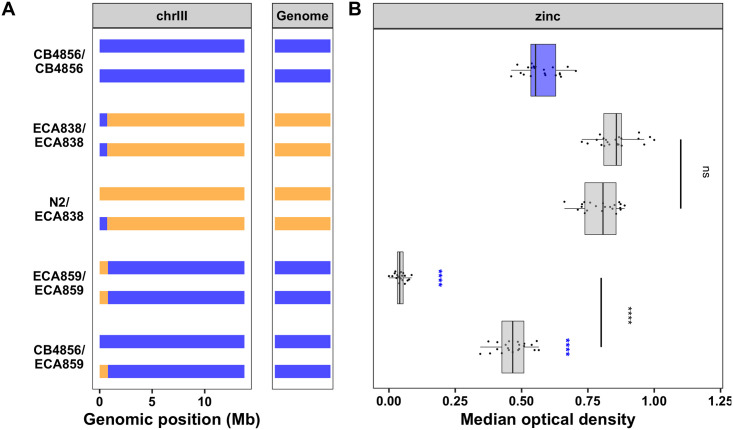
Fig 3. Dominance of chromosome III QTL.
(A) Strain genotypes are shown as colored rectangles (N2: orange, CB4856: blue) in detail for chromosome III (left) and in general for the rest of the chromosomes (right). Each rectangle represents a single copy of chromosome III. (B) Normalized residual median optical density in zinc (median.EXT, x-axis) is plotted as Tukey box plots against strain (y-axis). The N2 strain, which is normally resistant to zinc, displayed an abnormal growth phenotype in this one experiment and was omitted. Because the phenotypic comparisons relevant for dominance are between NIL strains and the CB4856 strain, this omission does not affect the results. Statistical significance of ECA859/ECA859 and CB4856/ECA859 to CB4856 is shown above each cross (ns = non-significant (p-value > 0.05); *, **, ***, and *** = significant (p-value < 0.05, 0.01, 0.001, or 0.0001, respectively).

