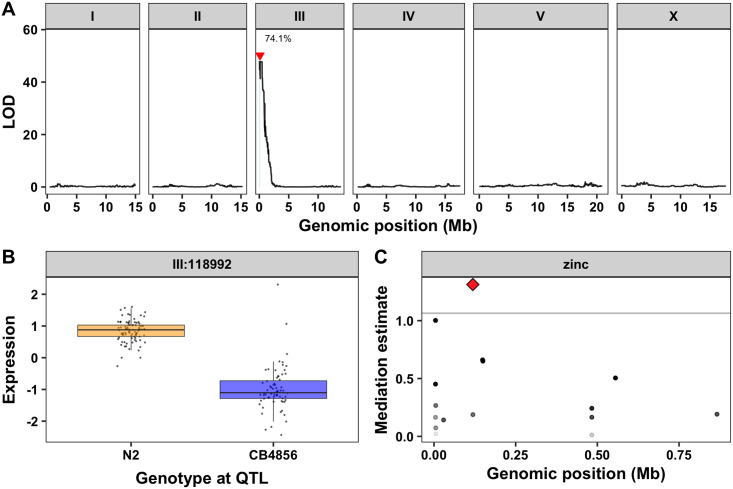
Fig 4. Expression QTL mapping and mediation analysis for sqst-5.
(A) Results from the linkage mapping using expression of sqst-5 as a quantitative trait. Genomic position (x-axis) is plotted against the logarithm of the odds (LOD) score (y-axis) for 13,003 genomic markers. The significant QTL is indicated by a red triangle at the peak marker and a blue rectangle shows the 95% confidence interval around the peak marker. The percentage of the total variance in the RIAIL population that can be explained by the QTL is shown above the QTL. (B) The expression of sqst-5 (y-axis) of RIAILs split by genotype at the marker with the maximum LOD score (x-axis) are plotted as Tukey box plots. Each point corresponds to a unique recombinant strain. Strains with the N2 allele are colored orange, and strains with the CB4856 allele are colored blue. (C) Mediation estimates calculated as the indirect effect that differences in expression of each gene plays in the overall phenotype (y-axis) are plotted against genomic position of the eQTL (x-axis) on chromosome III for all 17 genes with an eQTL in the drug-response QTL confidence interval. The 95th percentile of the distribution of mediation estimates is represented by the horizontal grey line. The confidence of the estimate increases (p-value decreases) as points become more solid. sqst-5 is represented by a red diamond.

