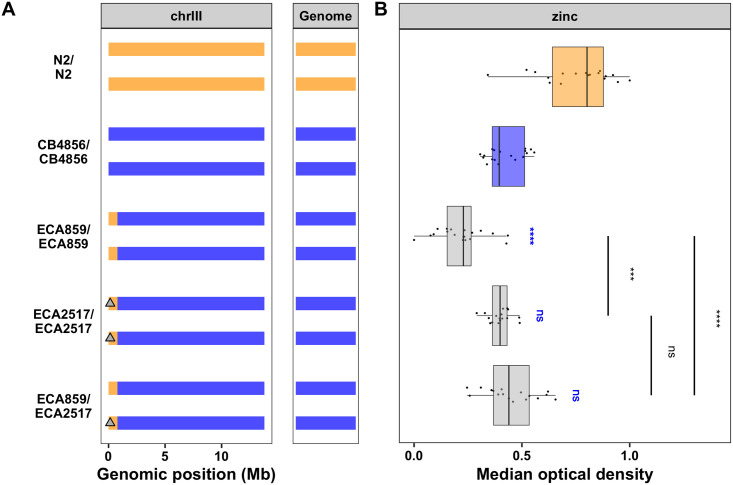
Fig 5. The gene sqst-5 confers zinc sensitivity.
(A) Strain genotypes are shown as colored rectangles (N2: orange, CB4856: blue) in detail for chromosome III (left) and in general for the rest of the chromosomes (right). Each rectangle represents a single copy of chromosome III, and grey triangles represent sqst-5 deletions. (B) Normalized residual median optical density in zinc (median.EXT, x-axis) is plotted as Tukey box plots against strain (y-axis). Statistical significance of each strain compared to CB4856 is shown above each strain and NIL pairwise significance is shown as a bar above strains (ns = non-significant (p-value > 0.05); *, **, ***, and *** = significant (p-value < 0.05, 0.01, 0.001, or 0.0001, respectively).

