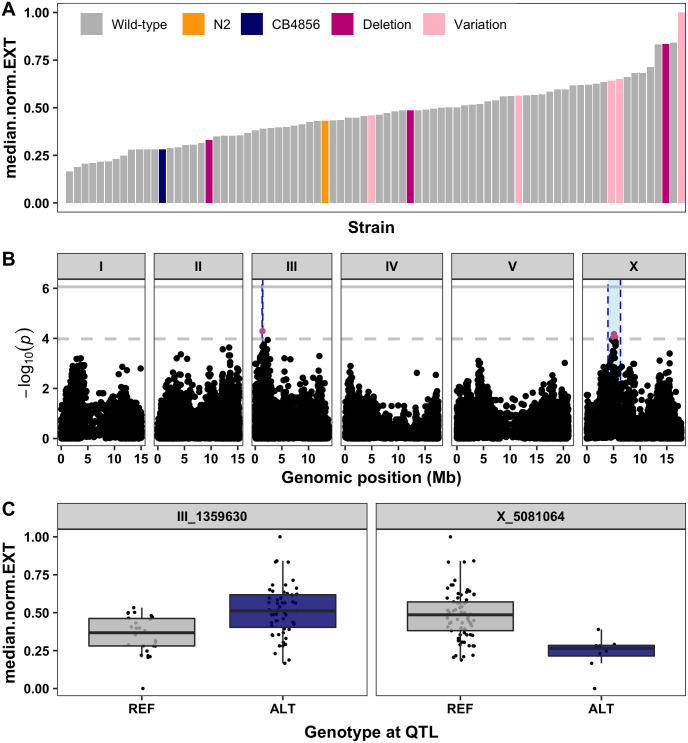
Fig 7. Genome-wide association (GWA) mapping suggests common variation at sqst-5 is associated with differences in zinc responses among wild isolates.
(A) Normalized residual median normalized optical density (median.norm.EXT, y-axis) of 81 wild isolates (x-axis) in response to zinc supplementation. Strains are colored by the parental strains N2 (orange) and CB4856 (blue) or by the sqst-5 variation (Deletion: magenta, other variation: light pink) (B) GWA results are shown. Genomic position (x-axis) is plotted against the -log10(p) value (y-axis) for each SNV. SNVs are colored pink if they pass the genome-wide eigen-decomposition significance threshold designated by the dotted grey line. The solid grey line represents the more stringent Bonferroni significance threshold. The genomic regions of interest that pass the significance threshold are highlighted by blue rectangles. (C) For each QTL, the normalized residual median normalized optical density (median.norm.EXT, y-axis) of strains split by genotype at the peak marker (x-axis) are plotted as Tukey box plots. Each point corresponds to a wild isolate strain. Strains with the N2 reference allele are colored grey, and strains with an alternative allele are colored navy.

