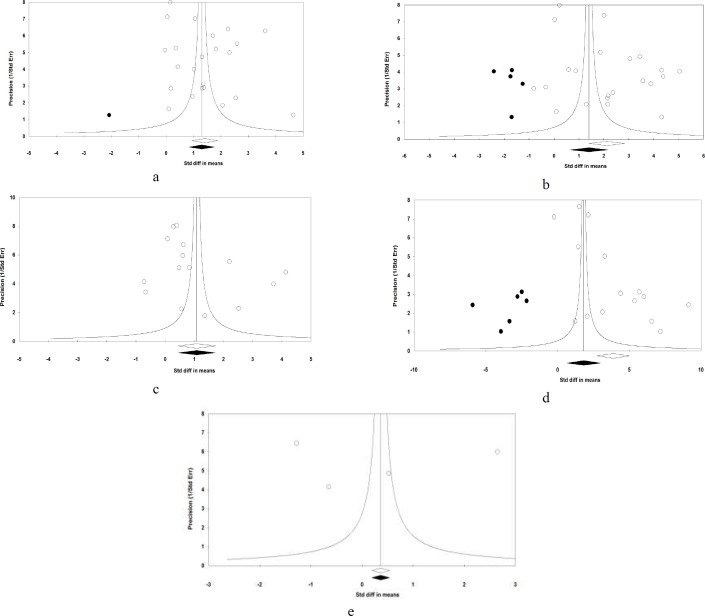
Figure 3.
a) Forest plot assessing standardized mean difference (SMD) and 95% confidence intervals for the association between TBil concentration with severity of COVID-19 in admitted and hospitalized patients, and b) Random-effects funnel plot detailing publication bias after trimming and filing in the studies investigating the association between TBil concentration with severity of n-COVID-19 in admitted and hospitalized patients. Open circles represent observed published studies; closed circles represent imputed unpublished studies. Meta-analysis was performed using a random-effects model with inverse variance weighting

