. 2020 Nov 6;9:e54835. doi: 10.7554/eLife.54835

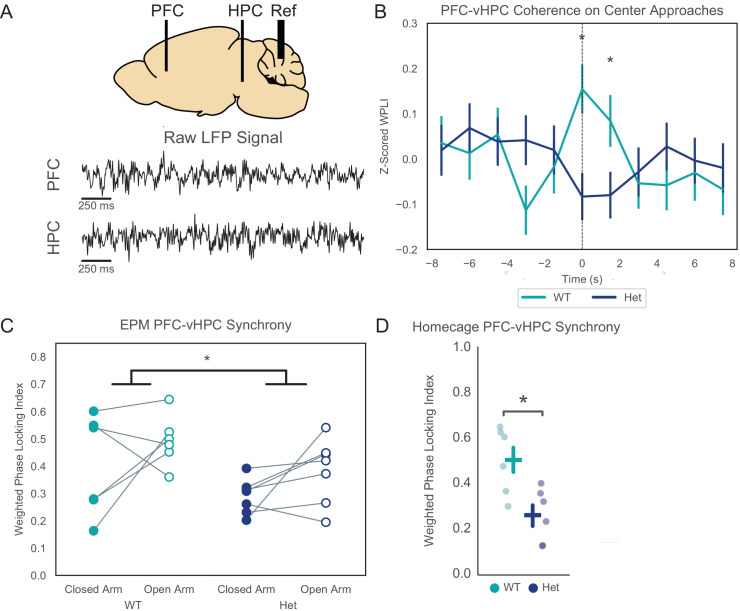
Figure 2. Pogz+/- mice have reduced vHPC-PFC theta synchrony both at baseline and in the elevated-plus maze (EPM).

(A) Recording schematic and examples of raw local field potential traces. (B) Z-scored theta band weighted-phase locking index (WPLI) as mice approach the center of the EPM. Linear mixed effects model using timepoint (−3,–1.5, 0, and +1.5 s relative to center zone entry), genotype, mouse, and timepoint X genotype interaction as fixed factors and individual run as a random factor, p=0.00039 for timepoint X genotype interaction, t-statistic = −3.55, DF = 2355 for fixed factors, n = 274 and 316 closed-center runs from 7 WT mice and 6 Het mice, respectively. Wilcoxon rank-sum test for t = 0: U = 3.3738, p=0.0007, for t = 1.5: U = 2.0275, p=0.043 (n = 274 closed-center runs from 7 WT mice and 316 from 6 Het mice). (C) Average theta band WPLI in the open vs. closed arms of the EPM. Two-way ANOVA including arm and genotype as factors - significant effect of genotype: p=0.03 (d.f. = 1, N = 6 WT and 7 Het mice, F = 5.66). (D) Theta band WPLI for mice in their homecages: U = 2.2417, p=0.031 (Wilcoxon rank-sum with N = 6 WT and 7 Het mice).

Figure 2—source data 1. Source data for Figure 2.

Figure 2.

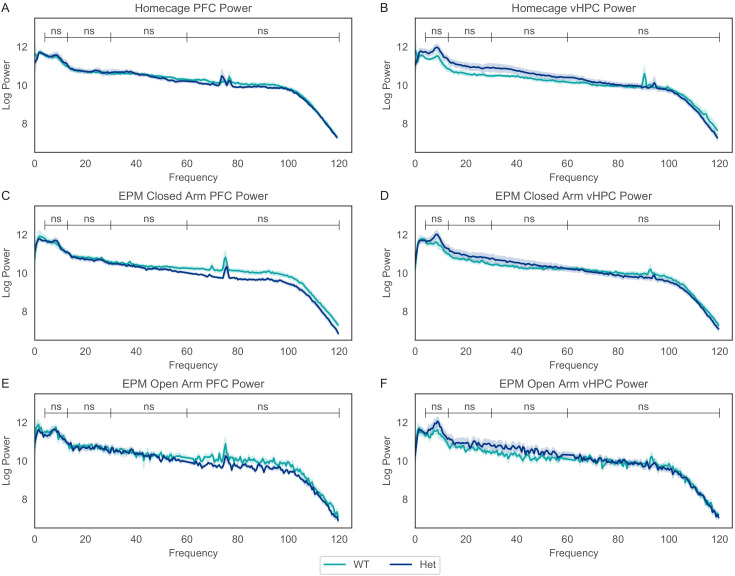
Figure 2—figure supplement 1. LFP power in various frequency bands in the vHPC and mPFC is not changed in Pogz+/- mice.

Figure 2—figure supplement 1.

(A) mPFC LFP power in home cage: θ (4–12 Hz), U = −0.3202, p=0.81; β (12–30 Hz), U = 0, p=0.94; low γ (30–55 Hz), U = −0.801, p=0.47; high γ (65–100 Hz), U = −0.3202, p=0.8. (B) vHPC LFP power in the home cage: θ, U = −1.281, p=0.23; β, U = −1.761, p=0.093; low γ, U = −1.441, p=0.17; high γ, U = 0, p=0.94. (C) mPFC LFP power in EPM closed arm: θ, U = −0.142, p=0.88; β, U = 0, p=1.0; low γ, U = 1.285, p=0.20; high γ, U = 1.642, p=0.10. (D) vHPC LFP power in EPM closed arm: θ, U = −1.142, p=0.25; β, U = −1.428, p=0.15; low γ, U = −0.714, p=0.47; high γ, U = 0.1428, p=0.89. (E) mPFC LFP power in EPM open arm: θ, U = −0.142, p=0.89; β, U = −0.1428, p=0.89; low γ, U = 0, p=1.0; high γ, U = 1.428, p=0.15. (F) vHPC LFP power in EPM open arm: θ, U = −1.0, p=0.32; β, U = −1.285, p=0.20; low γ, U = −1.142, p=0.25; high γ, U = 0.0, p=1.0. All statistics from Wilcoxon Rank-Sum Tests, WT N = 6, Het N = 7.
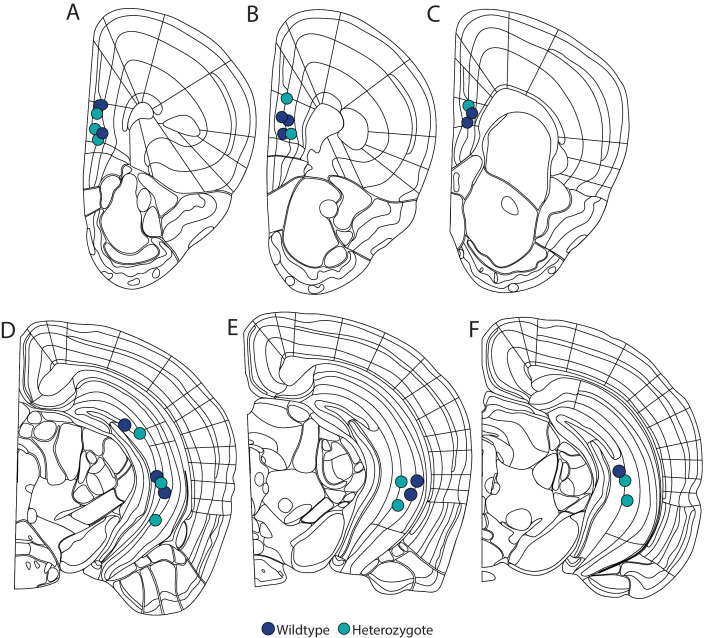
Figure 2—figure supplement 2. Location of LFP electrodes (A–C) mPFC electrode locations.

Figure 2—figure supplement 2.

(A) AP 1.745, (B) AP 1.645, (C) AP 1.42. (D–F) vHPC electrode locations. (D) AP −2.78, (E) AP −2.98, (F) AP −3.18. Images from Allen Mouse Brain Atlas (Lein et al., 2007).