. 2020 Nov 6;9:e54835. doi: 10.7554/eLife.54835

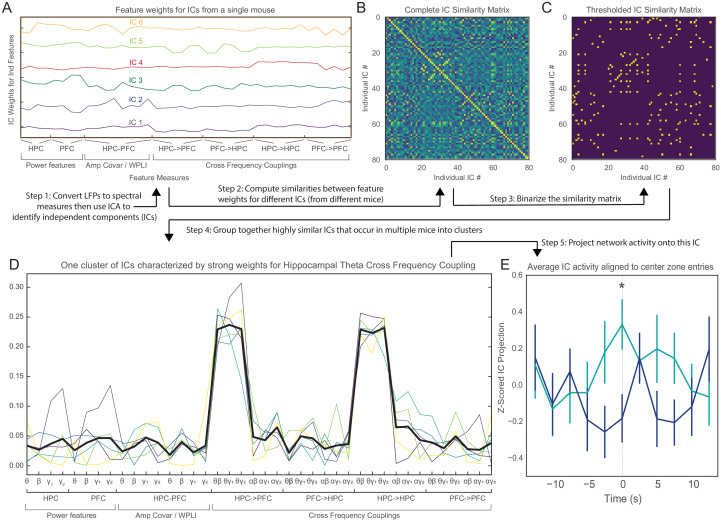
Figure 3. An unbiased, data-driven approach confirms that theta-frequency vHPC-mPFC communication is behaviorally-relevant and deficient in Pogz+/- mice.

(A) Example weight vectors showing how various LFP features (x-axis) contribute to different independent components (ICs) in one mouse. The y-axis shows the weight of each feature. (B) Correlation matrix showing the similarity of weight vectors corresponding to different ICs, from all mice. (C) Binarized version of the correlation matrix showing pairs of ICs that have a correlation coefficient > 0.7. (D) Example weights vectors (light, colored traces) for ICs from one cluster. This cluster is characterized by strong weights for cross-frequency coupling between vHPC theta activity and higher-frequency activity in either vHPC or mPFC. The bold black trace shows the average of these weight vector. (F) The projection of network activity onto the characteristic (averaged) weight vector (from E) as a function of time during approaches to the center of the EPM, for wild-type or Pogz+/- mice. As mice approach the center, activity in this characteristic IC rises sharply and reaches a peak in WT mice, but this is absent in Pogz+/- mice. Linear mixed effects model using timepoints (t = 0 vs. baseline based on the average of the first/last points), mouse, genotype, and timepoint X genotype interaction as fixed factors, and individual runs as random factors, timepoint X genotype interaction p=0.01, DF = 147, t-statistic = 2.60; Wilcoxon rank-sum test for t = 0: p=0.007, U = 2.6864; n = 39 closed-center-open runs from 6 WT mice and 37 runs from 7 Het mice.

Figure 3.

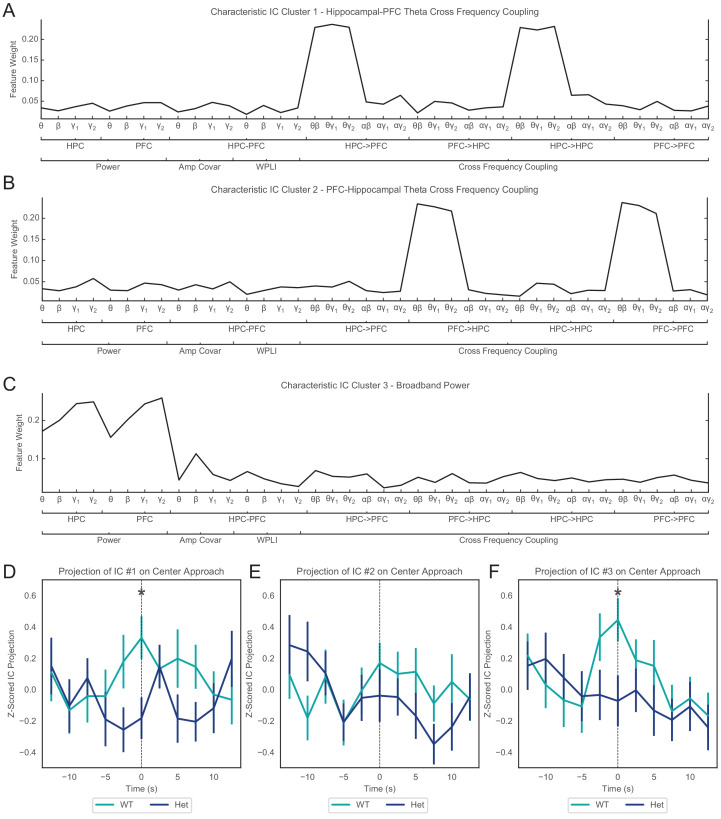
Figure 3—figure supplement 1. Activity in conserved independent components (ICs) during approaches to the center of the EPM.

Figure 3—figure supplement 1.

(A–C) Weights for the three ICs that were conserved across mice, i.e., were defined by clusters of ICs that were from different mice but were very similar, as indicated by strong correlations (we averaged the weights of the individual ICs in each cluster to obtain the weights shown here). (A) Shows weights for the characteristic IC highlighted in Figure 3, which corresponds to cross-frequency phase-amplitude coupling between hippocampal-theta and beta or gamma activity in the hippocampus or PFC. The characteristic IC shown in (B) corresponds to cross-frequency phase-amplitude coupling between prefrontal theta and beta or gamma activity in the hippocampus or PFC. The characteristic IC shown in (C) corresponds to broadband power across all frequency bands in the hippocampus and PFC. (D–F) The projection of network activity onto each characteristic (averaged) weight vector (from A-C) as a function of time during approaches to the center of the EPM, for wild-type or Pogz+/- mice. The first and third characteristic ICs (panels D and F) both exhibit increased activity during center approaches in WT mice, but this increase was absent/deficient in Pogz mutant mice: U = 2.6864, p=0.007 and U = 2.4266, p=0.015 for IC #1 and IC #3, respectively, by Wilcoxon rank-sum test, n = 39 closed-center-open runs from 6 WT mice and 37 runs from 7 Het mice. Linear mixed effects model for IC #1 is described in Figure 3E. For IC #3, the same linear mixed effects model yields p=0.052 (t statistic = 1.96) for the timepoint X genotype interaction.